Container PPT Wide Template – Efficient Business Presentation Design
J0300043
- Last Update 01/29/2025
- File Size 18.7MB
- # of Slides 36
- File Format PPTX
- Slide Ratio 16:9
- Color
Slide Preview


Keywords
About the Product
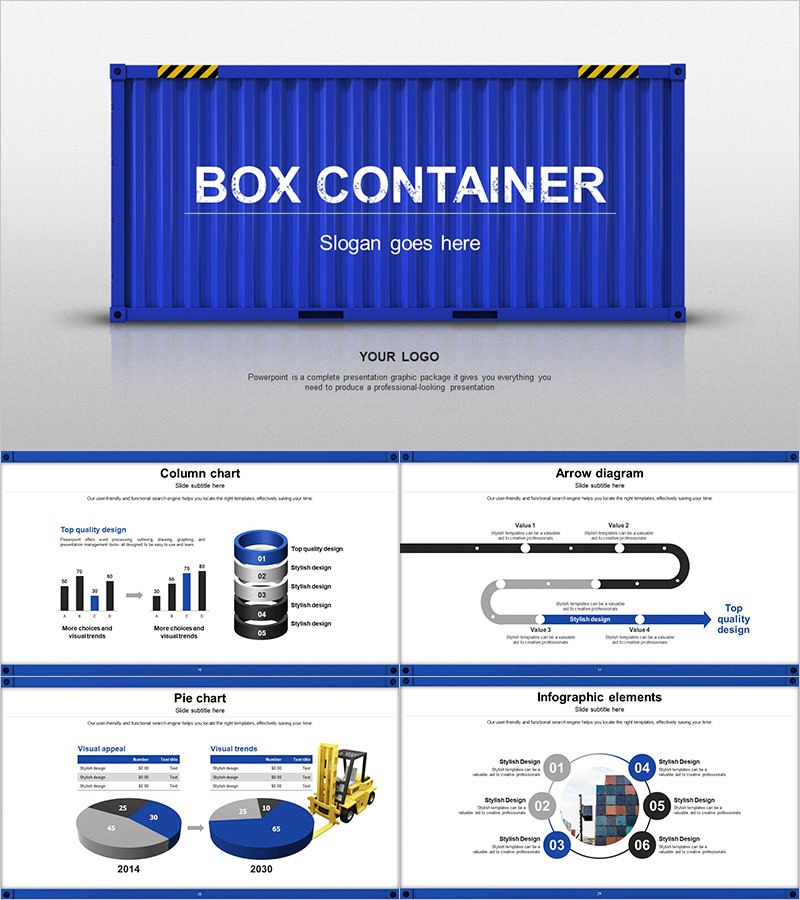
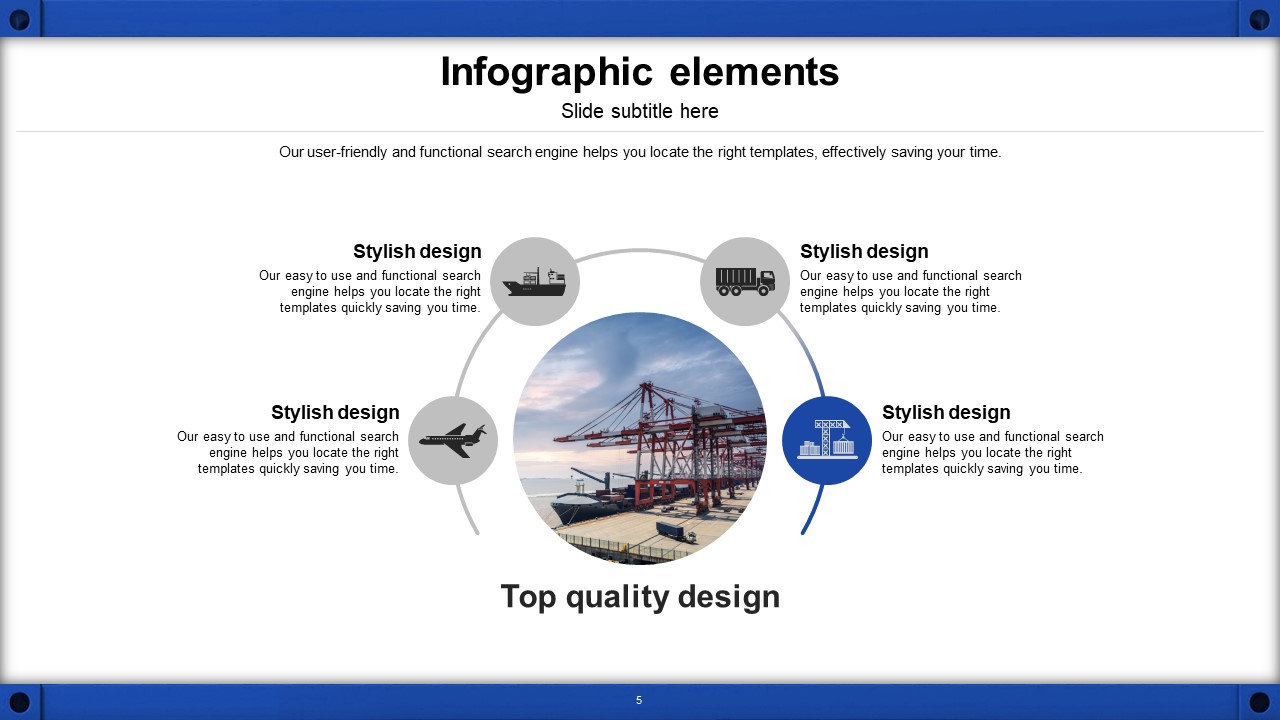
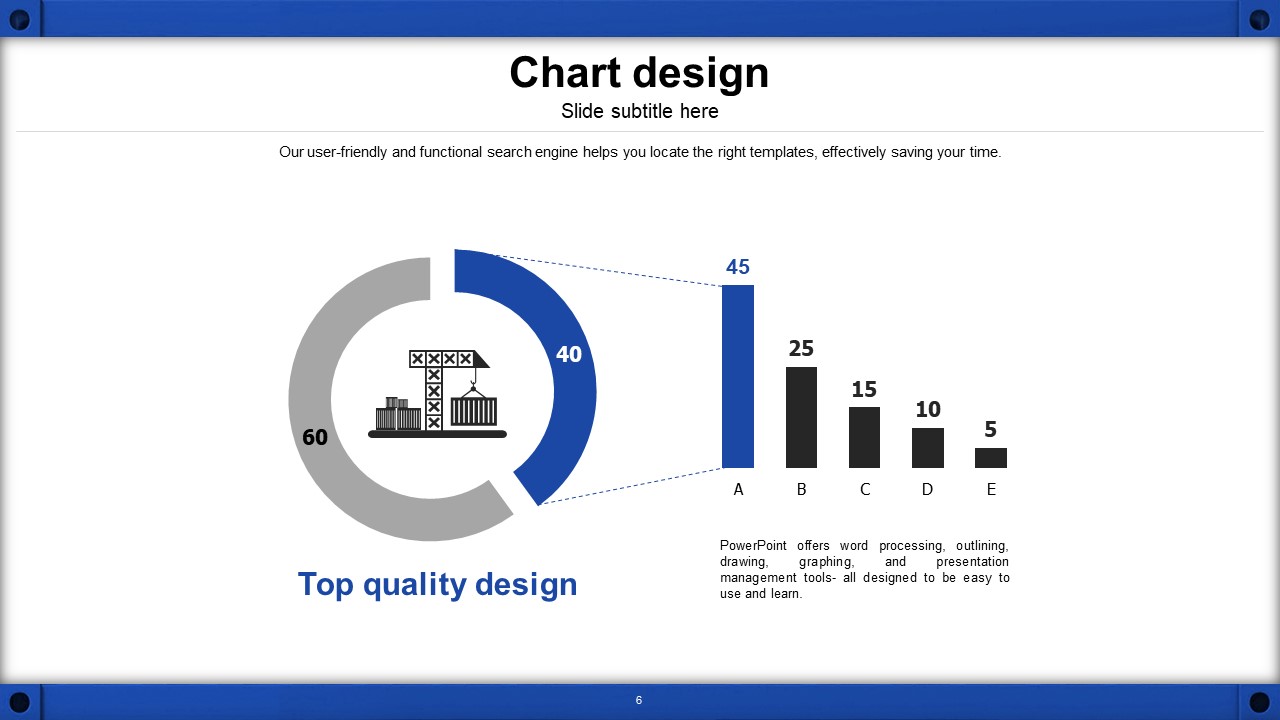
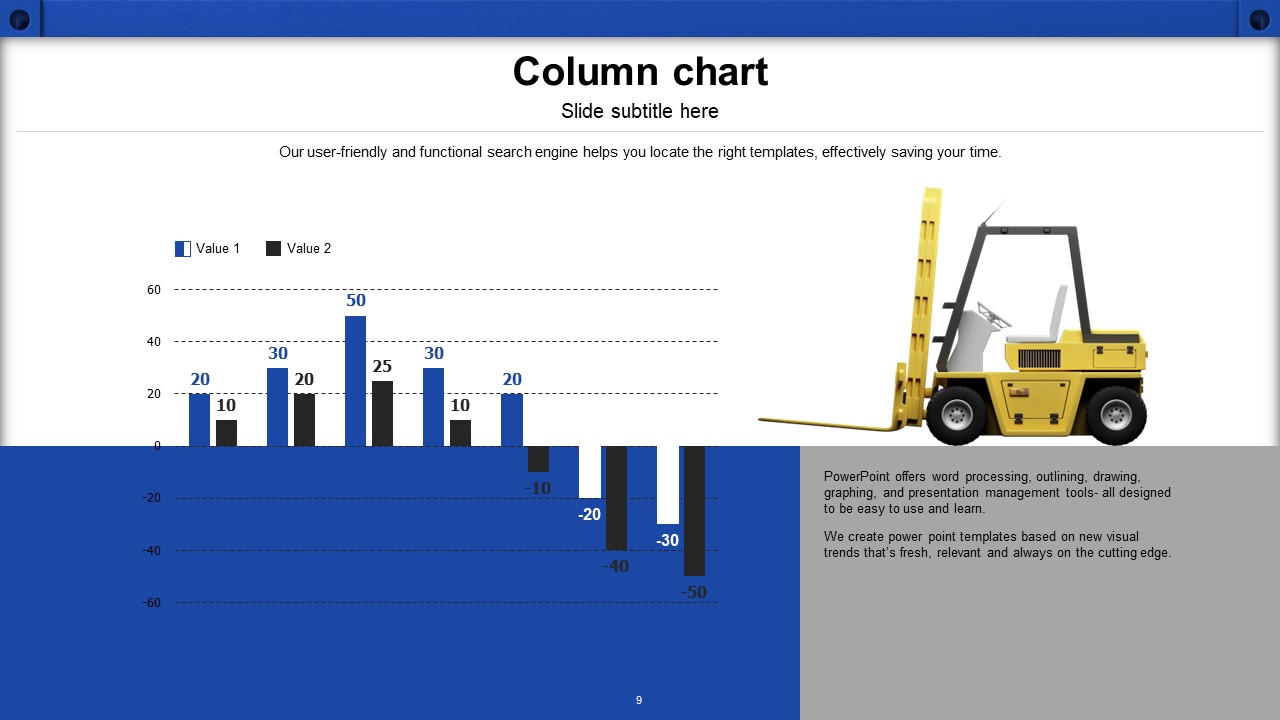
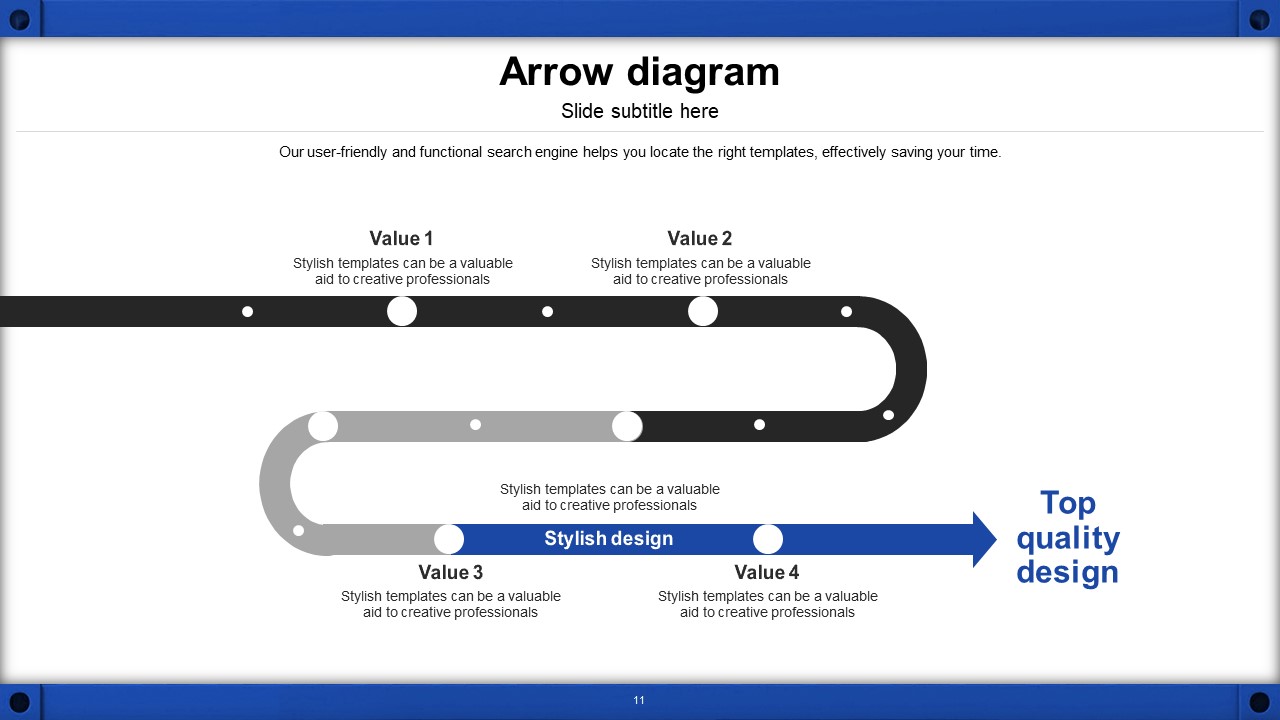
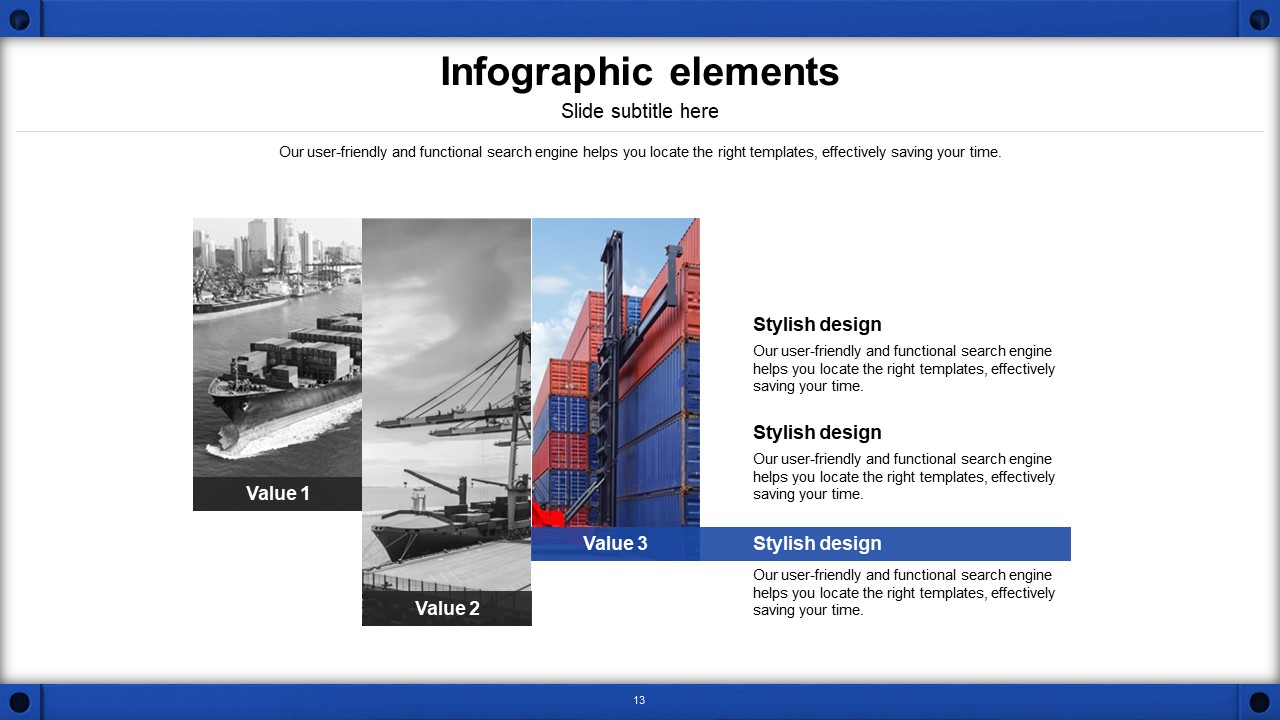
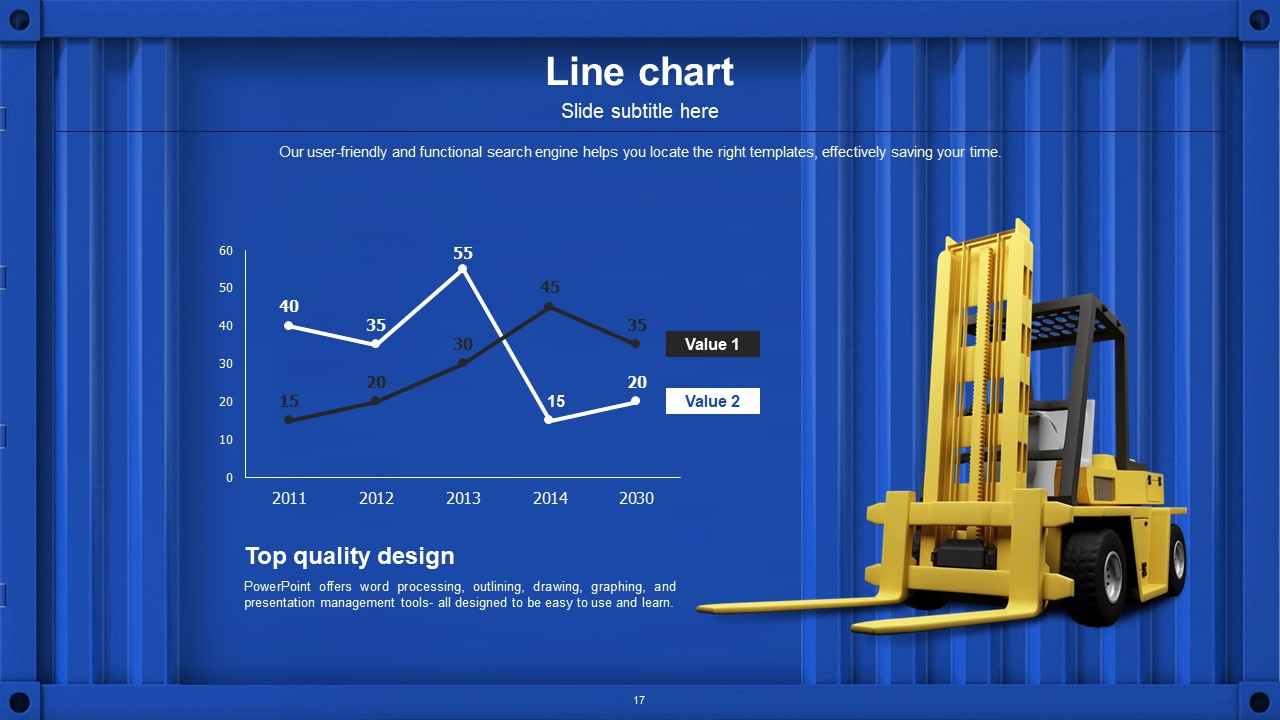
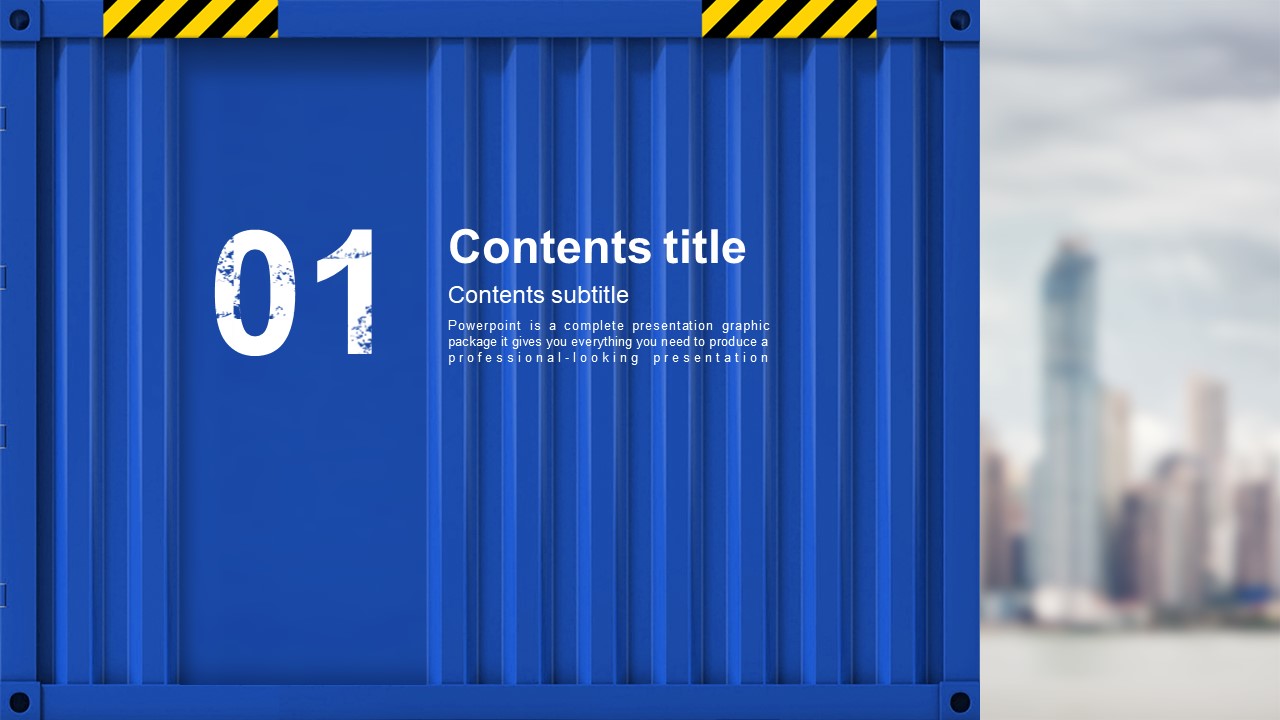
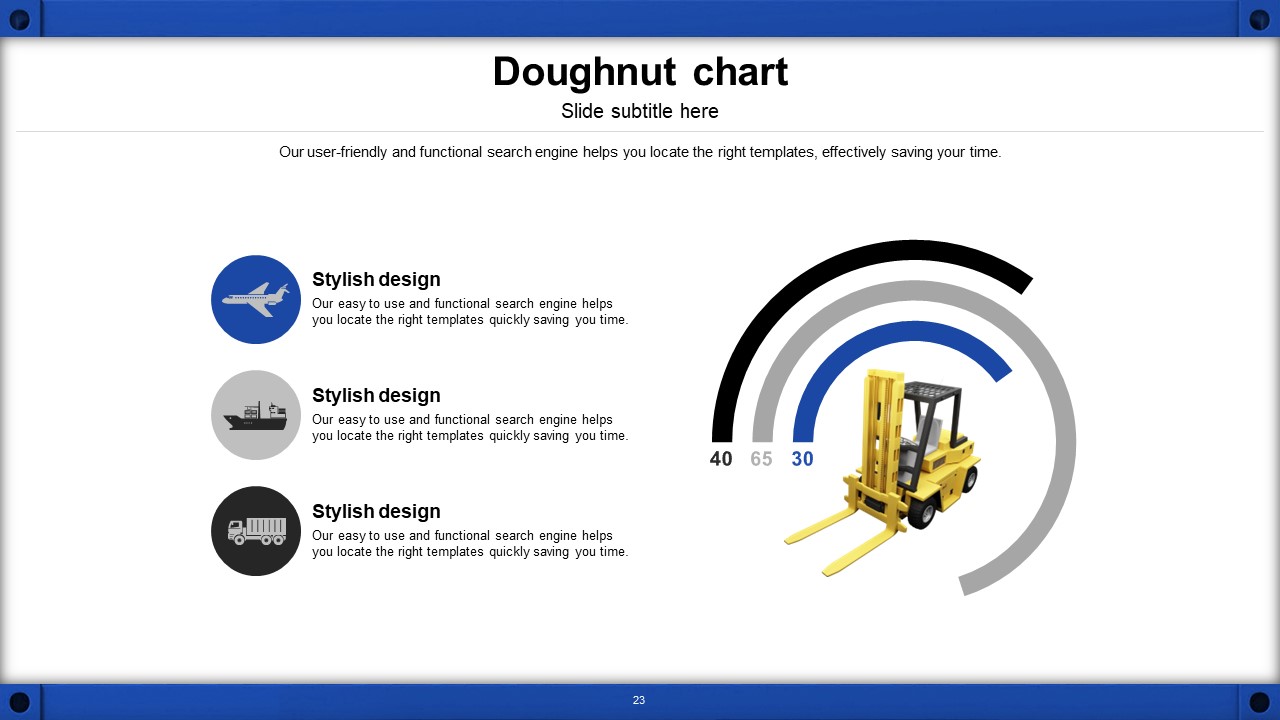
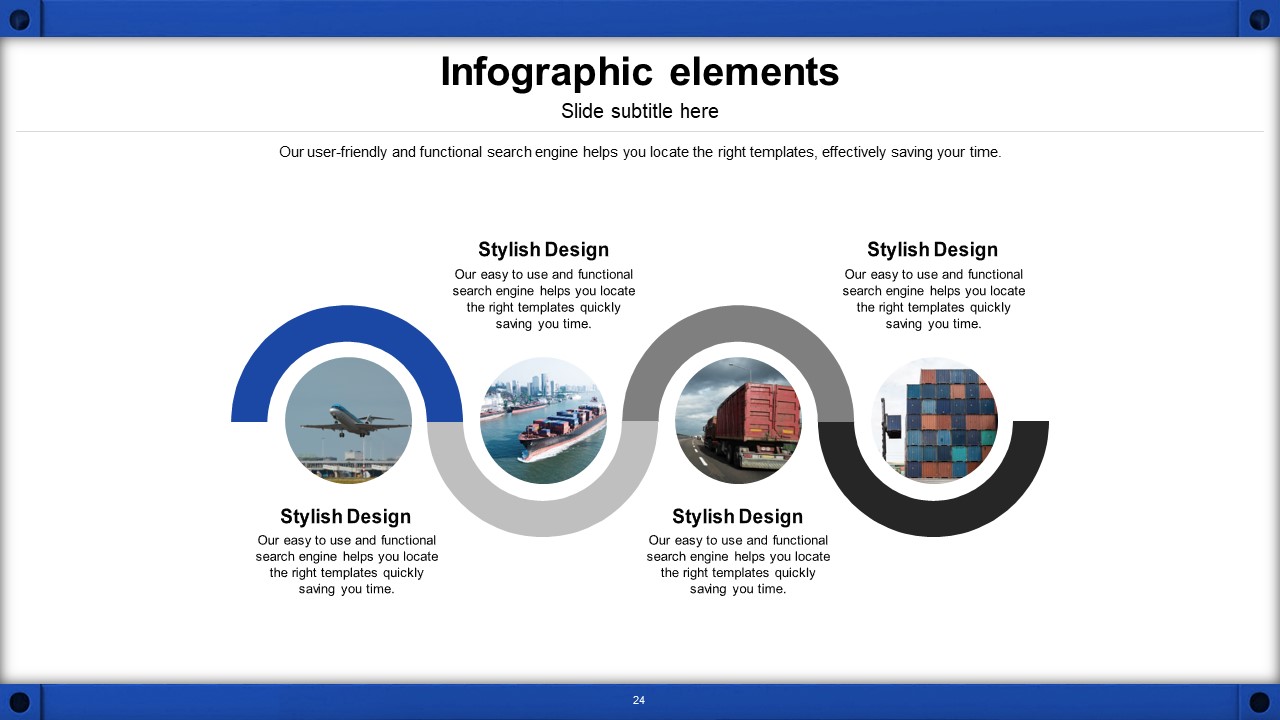
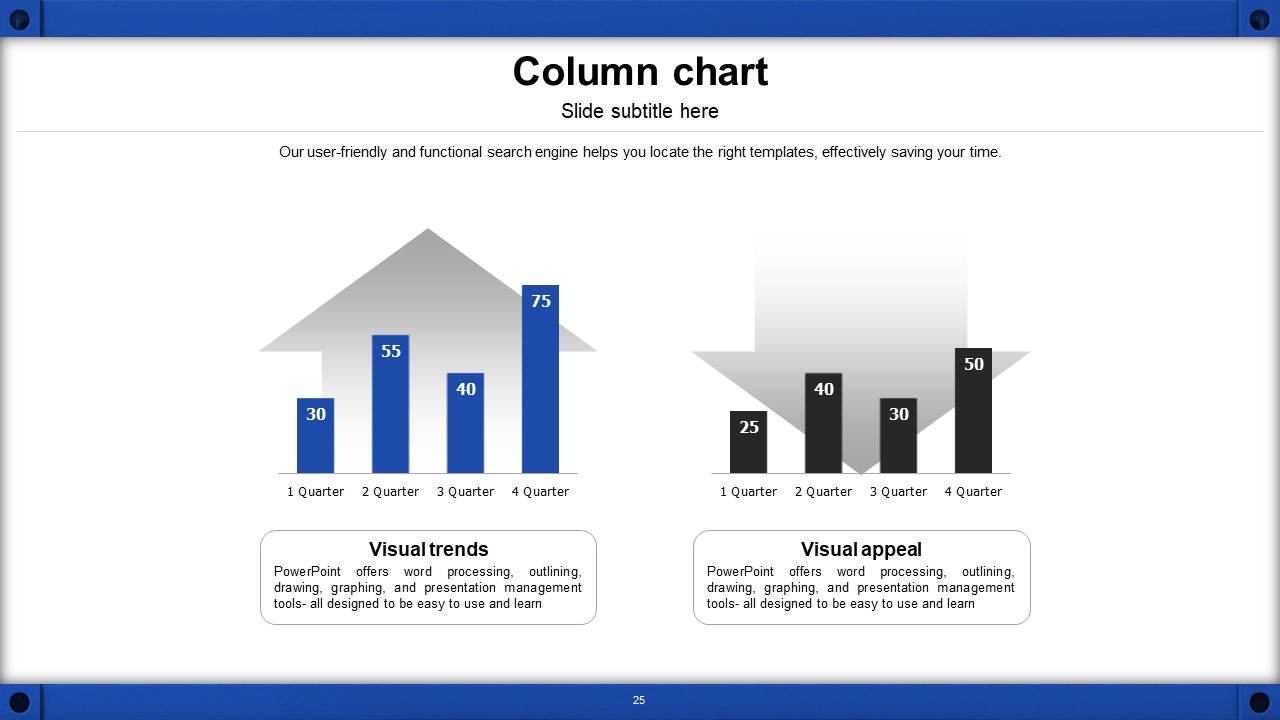
A professional PowerPoint template designed for logistics, shipping, and trade industry presentations. The cover slide features a photorealistic blue shipping container image that immediately communicates industry identity, while interior slides use a clean white background with royal blue accent lines and borders for a structured, data-driven look. The 36-slide set includes bar charts, pie charts, 3D cylinder charts, a 4-step arrow roadmap diagram, a 6-item numbered infographic, and a global map slide with a US regional breakdown — giving you everything needed for supply chain reports, logistics performance reviews, and global business presentations. All slides are fully editable in PPTX format, allowing you to update text, chart data, and colors to match your brand. Ideal for investor meetings, partner proposals, and internal management reporting across the transportation and logistics sector.
Usage Points
-
Main Usage
Designed for logistics, shipping, freight, and supply chain professionals who need a polished presentation for business reporting, investor meetings, or partner proposals. The container-themed design instantly establishes industry credibility.
-
How to Use
Open the PPTX file and replace the placeholder text, chart data, and logo with your own content. The royal blue container cover and blue accent lines are pre-designed — simply update the data and your presentation is ready to deliver.
-
Recommended For
Recommended for logistics managers, supply chain analysts, trade company executives, and business development teams in the transportation and freight industry. Suitable for investor pitches, operational reviews, and partner briefings.
-
Slide Structure
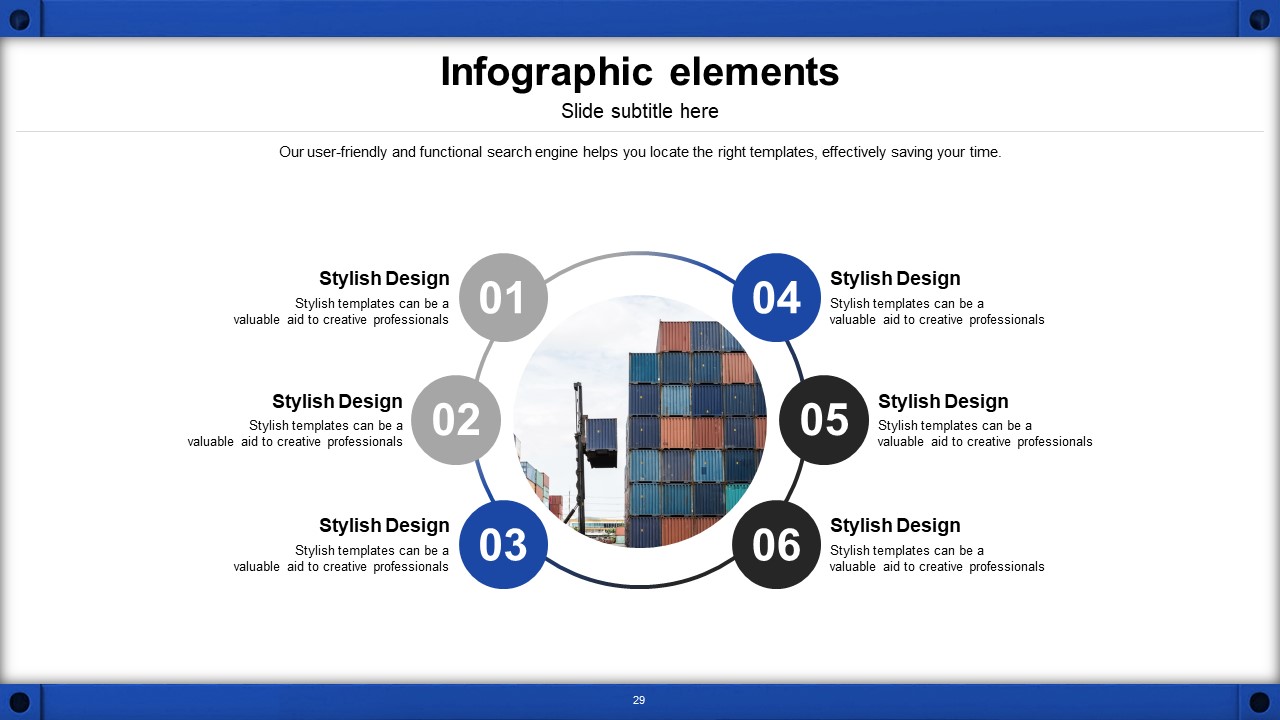
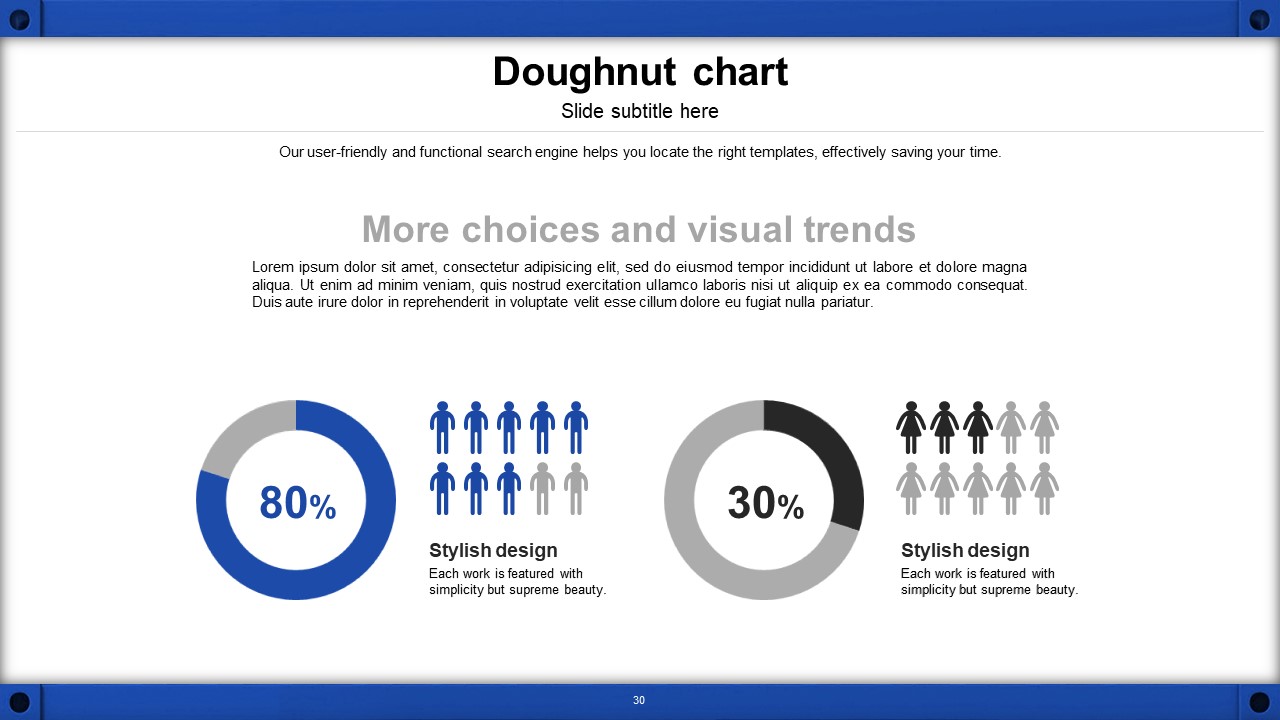
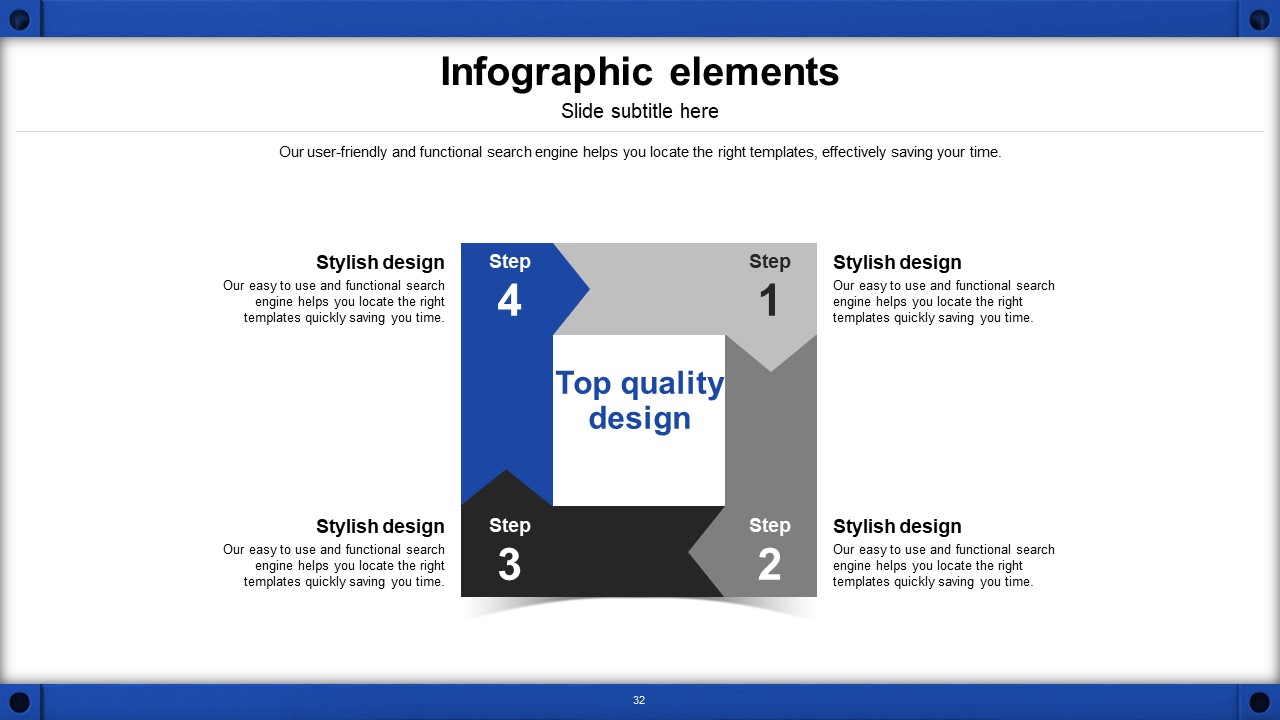
Includes a photorealistic container cover slide, column and 3D cylinder charts, a 4-step arrow roadmap diagram, pie chart comparison slides, a 6-item numbered infographic with container imagery, and a global map slide with regional callouts — 36 slides total.
Related Products
-

Opinion PPT Wide – Stylish Design for Effective Presentations
#Business
-

Partnership PowerPoint Template – Ideal for Business Presentations
#Business
-

Multitasking Presentation Template – Optimized Design for Business
#Business
-

Entertainment Company Presentation Template – Stylish and Colorful Design
#Business
