Horizontal Bar Chart with Highlighted Emphasis – Market and Competitive Analysis
RJ0300043_25
- Last Update 04/29/2025
- File Size 3.3MB
- # of Slides 2
- File Format PPTX
- Slide Ratio 16:9
- Color
Keywords
About the Product
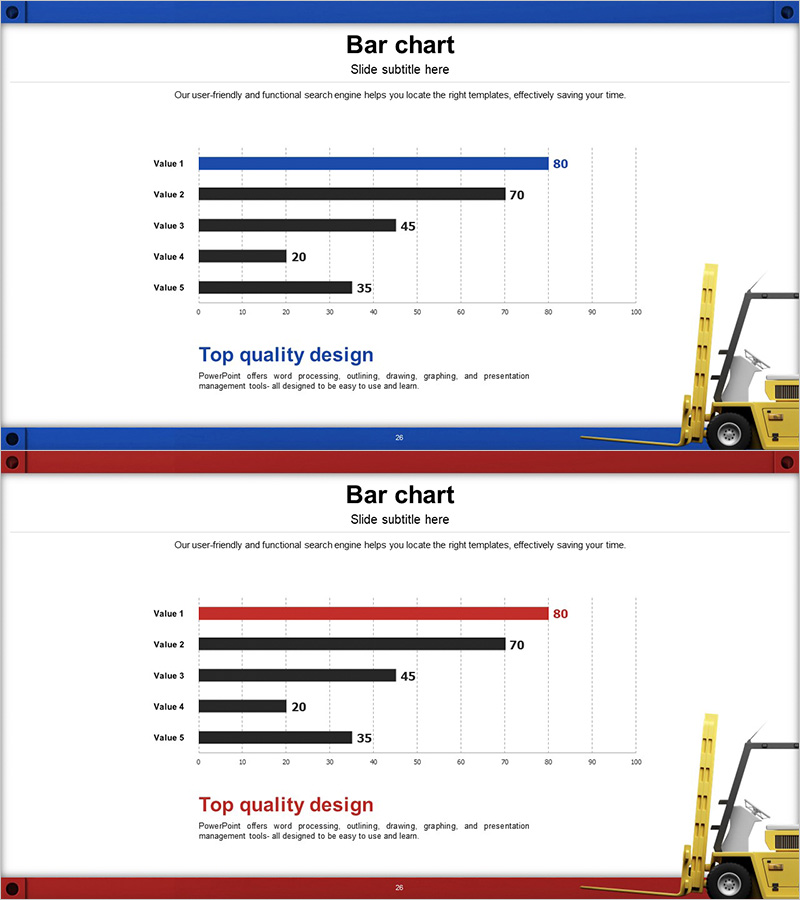
A horizontal bar chart PowerPoint slide that visually compares market trends and competitive performance across five data points. The bars extend left-to-right with one highlighted bar in blue or red and four comparison bars in black and gray, making size differences and rankings immediately apparent. A clear 0–100 horizontal axis ensures data credibility and easy interpretation. This 16:9 widescreen, 2-slide template is ready to use for market analysis, competitive analysis, sales forecasting, and business presentations. All text labels, values, and colors are fully editable to match your corporate branding and data requirements.
Usage Points
-
Main Usage
Displays quantitative data—market size, revenue, market share, competitor performance—in a left-to-right layout that emphasizes size comparison. The highlighted bar (blue or red) draws attention to the key metric, while gray and black bars provide context for relative positioning and competitive standing.
-
How to Use
Insert into business plans, marketing proposals, and investor pitch decks in the market analysis or competitive analysis section. Double-click to edit item names and values. Customize bar colors and background to align with your brand identity. Use during presentations to guide audience focus through each data point sequentially.
-
Recommended For
Marketing managers, business analysts, executives, consultants, and sales professionals presenting market conditions and competitive positioning. Effective for quarterly performance comparisons, product-line revenue analysis, customer satisfaction rankings, and data-driven business cases.
-
Slide Structure
Slide 1: One blue highlighted bar + four black/gray comparison bars, 5 item labels on left, 0–100 horizontal axis. Slide 2: One red highlighted bar + four black/gray comparison bars, identical layout. Both slides include 'Top quality design' text area at bottom.
Related Products
-

3D Printer Analysis Bar Graph
#Market and Competitor Analysis #Diagram #Graph
-

Market Outlook Insights with Bar Graph – Visualizing Business Performance
#Market and Competitor Analysis #Graph #Future Outlook
-

Monthly Market Analysis with Horizontal Bar Chart – Shaping the Future of the Market
#Market and Competitor Analysis #Graph #Future Outlook
-

Successful Business Future Outlook Analysis Graph
#Market and Competitor Analysis #Diagram #Graph
