Stacked Vertical Bar Chart Layout – Product Performance Analysis
RJ0300043_27
- Last Update 04/29/2025
- File Size 2.9MB
- # of Slides 2
- File Format PPTX
- Slide Ratio 16:9
- Color
Keywords
- #Content-Based Slides
- #Design-Based Slides
- #Product/Service Introduction
- #Marketing Plan and Strategy
- #Diagram
- #Graph
- #Development Status
- #Target Market Strategy
- #Cluster
- #Column
- #Closed Cluster Diagram
- #Segmented Column
- #16:9
- #stacked vertical bar chart PowerPoint
- #stacked bar graph template
- #performance analysis slide
- #multi-series chart template
- #how to create stacked bar chart in PowerPoint
About the Product
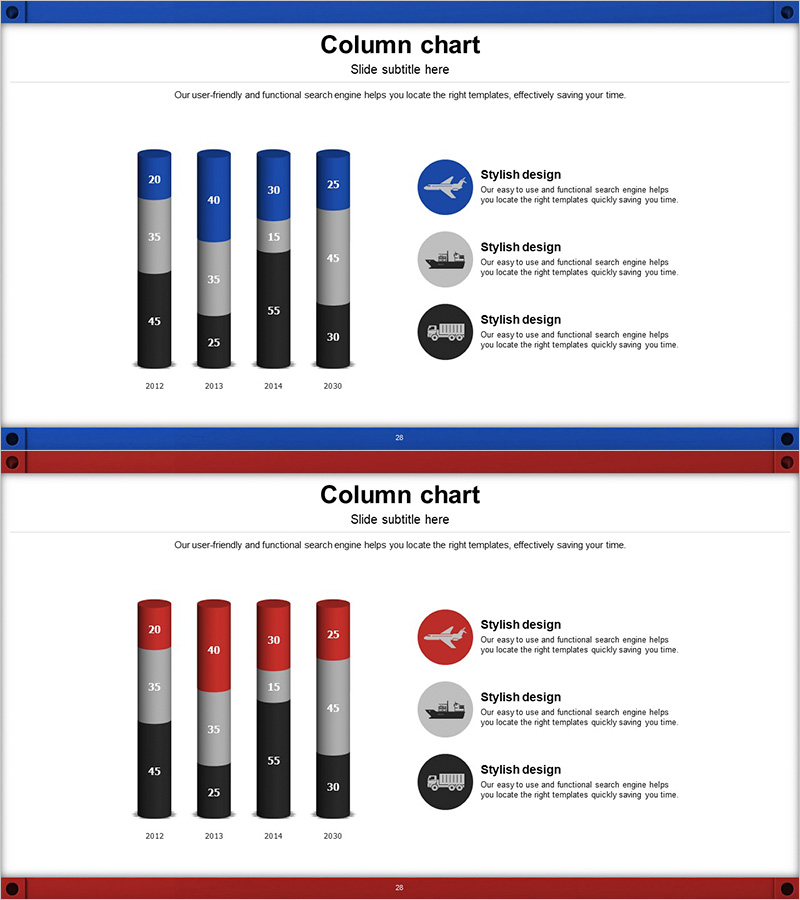
A stacked vertical bar chart PowerPoint slide designed for product performance analysis and marketing strategy presentations. Visualizes data across four series from 2012 to 2030 using a clear three-tone color palette of dark blue, gray, and black. Each bar displays both cumulative totals and individual series contributions, enabling viewers to assess overall trends and component impact simultaneously. The right side features icon-based explanation areas for highlighting key insights. Delivered as 2 slides in 16:9 widescreen format, ready for immediate use in executive reports and strategic presentations.
Usage Points
-
Main Usage
Compare product or service performance across multiple years by categorizing data into four or more series displayed in stacked vertical format. Simultaneously shows total magnitude changes and individual series contributions, making it ideal for executive reports, marketing performance reviews, and business plan presentations.
-
How to Use
Replace bar heights and color segments with your actual data values. Update the right-side icon area with key insights or strategic points in text form to connect visuals with messaging. Colors can be adjusted to match your corporate brand guidelines.
-
Recommended For
Marketing managers, business planning teams, financial analysts, and executive presenters who need to communicate quarterly or annual performance trends persuasively. Suitable for comparing product lines, regional performance, or customer segment results.
-
Slide Structure
Both slides feature identical layout: left side displays 4 stacked vertical bars (2012, 2013, 2014, 2030) with 4 series in dark blue, gray, black, and light tone, with numeric labels within each segment. Right side contains 3 circular icons with accompanying text explanation areas. Includes title and subtitle sections.
Related Products
-

Graph of Car Type Analysis by Year – Market Insights
#Product/Service Introduction #Market and Competitor Analysis #Diagram
-

Bar Graph of Progress Analysis by Task - Effective Visualization of Progress
#Product/Service Introduction #Market and Competitor Analysis #Marketing Plan and Strategy
-

Target Area Business Development Status – Cluster Analysis
#Product/Service Introduction #Market and Competitor Analysis #Diagram
-

Global Target Market Data Analysis - Insights into Markets
#Market and Competitor Analysis #Marketing Plan and Strategy #Diagram
