Visual Breakdown of Port Logistics
RJ0300043_12
- Last Update 04/29/2025
- File Size 3.6MB
- # of Slides 2
- File Format PPTX
- Slide Ratio 16:9
- Color
Keywords
- #Content-Based Slides
- #Design-Based Slides
- #Product/Service Introduction
- #Business Vision and Strategy
- #Diagram
- #Program Introduction
- #Business Goals
- #Cluster
- #Closed Cluster Diagram
- #16:9
- #port logistics diagram
- #cluster diagram PowerPoint
- #overlapping structure slide
- #business visualization presentation
- #logistics system diagram PowerPoint
About the Product
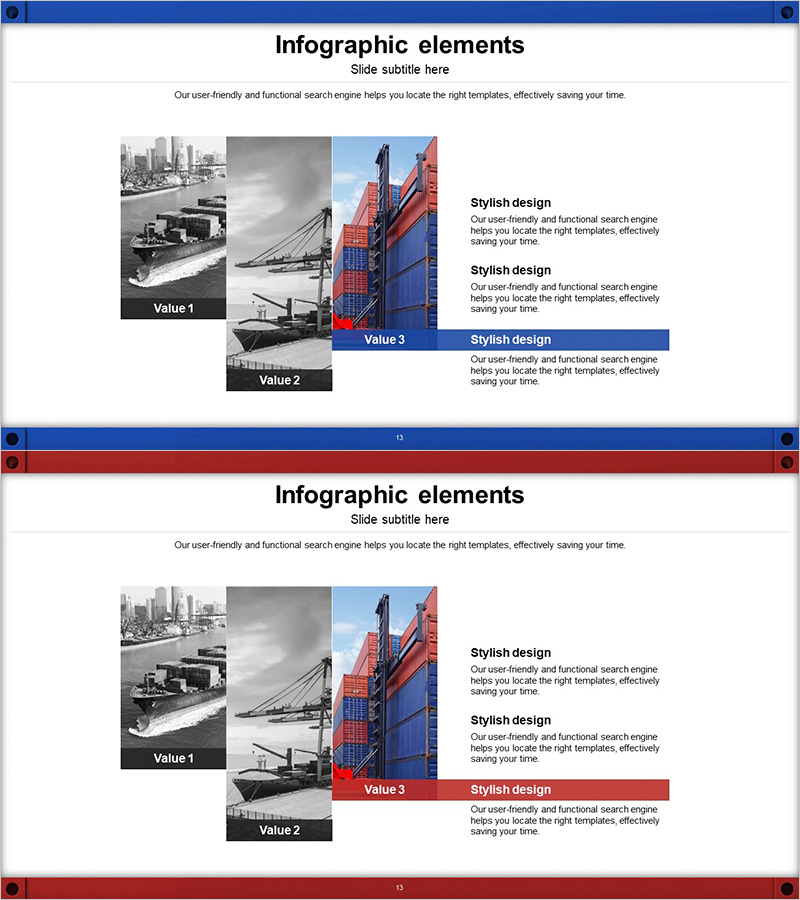
A cluster diagram PowerPoint slide that visualizes port logistics systems through three overlapping areas. Real photographs of cityscapes, port facilities, and construction equipment serve as backgrounds, with Value 1, 2, and 3 zones layered to intuitively express relationships and hierarchical structures among logistics elements. This PowerPoint presentation slide effectively communicates business strategy, operational objectives, and service architecture. The 2-slide set uses blue and red accent backgrounds to provide visual variety for your presentation materials.
Usage Points
-
Main Usage
Breaks down complex port, logistics, and transportation systems into overlapping zones to clarify relationships and interactions among elements. Effectively explains business structure, service layers, and operational domains simultaneously.
-
How to Use
Use in business presentations, strategy meetings, business proposals, and investor briefings to explain logistics processes and organizational structures. Edit text in each zone to customize the slide according to your business model.
-
Recommended For
Ideal for logistics, transportation, and port industry executives, business planners, marketing professionals, and consultants presenting strategy or business explanations. Recommended for any business presentation requiring explanation of complex systems.
-
Slide Structure
2-slide set. Each slide features a background of city, port, and construction imagery with 3 overlapping zones (Value 1, 2, 3) arranged as a cluster diagram. First slide emphasizes blue accents; second slide emphasizes red accents for visual variation.
Related Products
-

Introduction to Positive Business Practices – Professionalism and Trust
#Product/Service Introduction #Business Vision and Strategy #Diagram
-

Business Program Closure Diagram - Business Goals and Strategy
#Product/Service Introduction #Business Vision and Strategy #Diagram
-

Setting Financial Business Goals
#Product/Service Introduction #Business Vision and Strategy #Diagram
-

Introducing the Startup Business Program – Innovation and Growth
#Product/Service Introduction #Business Vision and Strategy #Diagram
