Road Freight Volume Visualization Truck Graph – Logistics Market Analysis
RJ0300043_13
- Last Update 04/29/2025
- File Size 4.2MB
- # of Slides 2
- File Format PPTX
- Slide Ratio 16:9
- Color
Keywords
- #Content-Based Slides
- #Design-Based Slides
- #Product/Service Introduction
- #Market and Competitor Analysis
- #Diagram
- #Product/Service Introduction
- #Market Analysis
- #Cluster
- #Closed Cluster Diagram
- #16:9
- #truck icon infographic PowerPoint
- #freight volume visualization slide
- #logistics data chart template
- #cargo truck icon grid
- #how to create logistics infographic in PowerPoint
About the Product
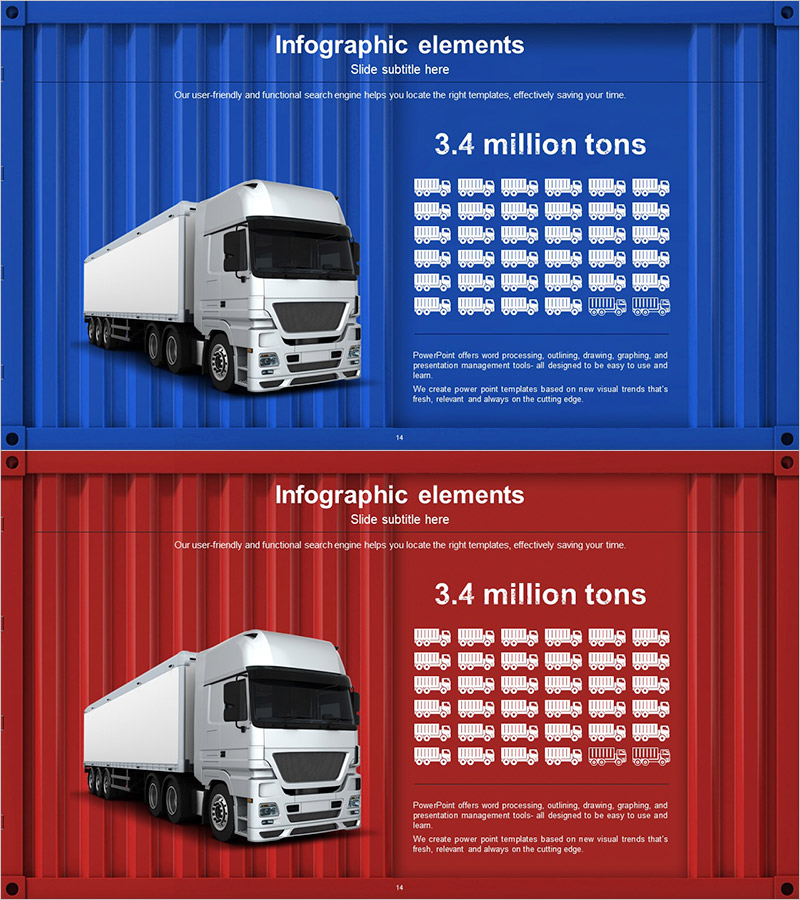
A logistics-focused infographic PowerPoint slide that visualizes freight volume and transportation data using repeated truck icons. Features a cargo truck mockup with dual-color backgrounds (blue and red) and a grid of truck icons representing large-scale shipment volumes (3.4 million tons). This 2-slide deck in 16:9 widescreen format is ready for immediate use in logistics company presentations, transportation market analysis reports, supply chain management briefings, and freight industry proposals. The combination of truck graphics and numerical data enhances audience comprehension and strengthens presentation impact.
Usage Points
-
Main Usage
Quantifies large-scale logistics data (tonnage, shipment volume, capacity) through repeated truck icon arrays. Paired with a cargo truck mockup, it communicates transportation metrics intuitively and supports market size analysis, competitor comparison, and growth trend visualization in logistics presentations.
-
How to Use
Slide 1 features a blue background while Slide 2 uses red, enabling color-based comparative analysis. Adjust the number of truck icons to represent different data values. Input specific figures, years, and company names in the text areas to customize the presentation for your logistics analysis.
-
Recommended For
Ideal for logistics and transportation company executive reports, supply chain management (SCM) presentations, freight market analysis reports, cargo transportation proposals, logistics industry seminars, international trade and import-export briefings, and shipping industry conferences.
-
Slide Structure
2-slide layout with each slide containing a cargo truck mockup (left), title and subtitle (top), numerical display (upper center), and a 6×5 grid of truck icons (30 repeated icons, right side). Optimized for 16:9 widescreen format.
Related Products
-

Maritime Freight Volume Chart – Understanding Marine Logistics Data
#Product/Service Introduction #Market and Competitor Analysis #Diagram
-

Infographic Slide Template for Visualizing Air Cargo Volume
#Product/Service Introduction #Market and Competitor Analysis #Diagram
-

Signature Tea Description – Premium Design Infographic
#Product/Service Introduction #Technical Approach #Diagram
-

Korean Traditional Culture Introduction Box – Capturing the Beauty of Tradition
#Product/Service Introduction #Diagram #Product/Service Introduction
