Conveyor Arrow Process Diagram
RJ0300043_10
- Last Update 04/29/2025
- File Size 2.9MB
- # of Slides 2
- File Format PPTX
- Slide Ratio 16:9
- Color
Keywords
- #Content-Based Slides
- #Design-Based Slides
- #Business Strategy
- #Business Management
- #Diagram
- #Step-by-Step Schedule Plan
- #Implementation Plan
- #Flow
- #Cluster
- #Linear Flow
- #Chain Diagram
- #16:9
- #conveyor belt arrow diagram
- #connector diagram PowerPoint
- #process flow presentation
- #4-stage arrow slide
- #transportation process diagram
- #business strategy execution template
About the Product
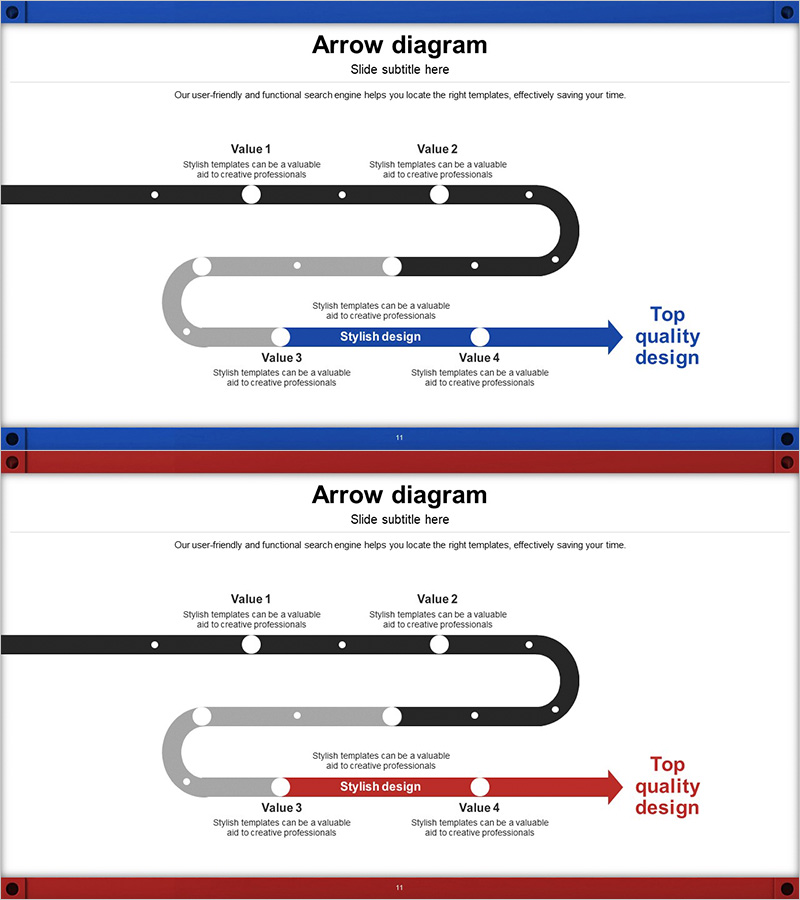
A conveyor belt-style arrow connector diagram PowerPoint slide designed to visualize transportation processes and business strategy execution. The diagram features a black and gray conveyor belt shape connecting four sequential values (Value 1 through Value 4), with a prominent blue arrow in the center highlighting the key message or final objective. Each stage includes dedicated text areas for detailed descriptions of process steps. The 2-slide set includes both blue and red color theme versions, allowing you to match your presentation's visual identity. Delivered in 16:9 widescreen PPTX format for immediate editing and deployment.
Usage Points
-
Main Usage
Ideal for illustrating transportation, logistics, and production processes in sequential stages. The conveyor belt connector structure clearly demonstrates continuity and flow between stages, while the central emphasis arrow draws attention to key messages or final objectives.
-
How to Use
Enter stage titles and descriptions in each Value section, and add your key message in the central blue arrow area. Select the color theme (blue or red) that matches your presentation's brand identity. All text and shapes are fully editable to customize for your specific content.
-
Recommended For
Perfect for logistics and transportation industry process explanations, business strategy execution presentations, supply chain management reports, production stage walkthroughs, and project milestone visualizations. Highly effective for executive presentations, team leader briefings, and project manager status updates.
-
Slide Structure
Two-slide set with identical conveyor belt diagram structure. Each slide features a title area at top, a central black and gray conveyor belt connecting four nodes (Value 1–4), descriptive text boxes below each node, and a right-aligned colored arrow (blue or red) with objective statement area.
Related Products
-

5-Step Linear Circle Diagram – Business Strategy
#Business Strategy #Business Management #Operational Plan
-

Schedule Diagram for Scientific Research – Detailed Implementation Plan
#Business Strategy #Business Management #Diagram
-

Phase-Based Execution Flow Diagram – Visualizing Business Strategy
#Business Strategy #Business Management #Diagram
-

Step-by-step Schedule Arrow Diagram – Visualizing Business Strategy
#Business Strategy #Business Management #Diagram
