Global Market Distribution Visualization – Effective Market Analysis
RJ0300043_34
- Last Update 04/29/2025
- File Size 3MB
- # of Slides 2
- File Format PPTX
- Slide Ratio 16:9
- Color
Keywords
- #Content-Based Slides
- #Design-Based Slides
- #Company Introduction
- #Market and Competitor Analysis
- #Other
- #Global Network
- #Target Market
- #Map
- #16:9
- #global map PowerPoint slide
- #world map presentation template
- #regional emphasis map slide
- #market analysis map PPT
- #how to visualize global market distribution in PowerPoint
About the Product
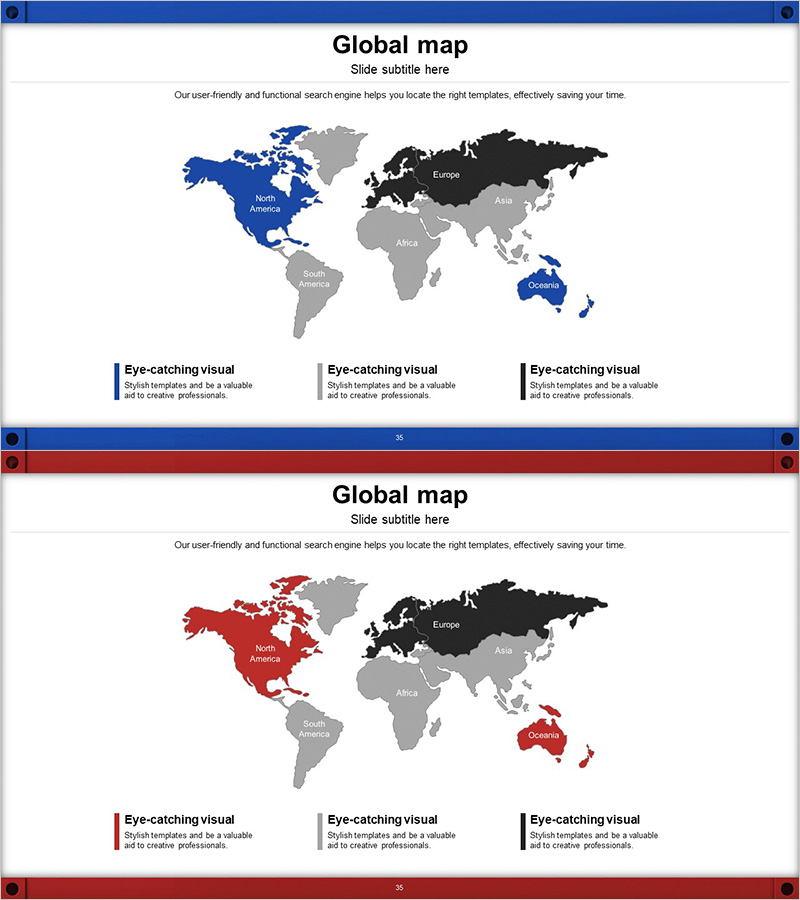
A 2-slide PowerPoint presentation that visualizes global market distribution with intuitive regional emphasis. North America, Europe, and Oceania are highlighted in distinct colors (blue and red), while other regions appear in gray for clear market segmentation. Each slide features a title area, subtitle, descriptive text, and three legend boxes, optimized for 16:9 widescreen format. This presentation template is ready to use for business pitches on market entry strategies, regional business status, and global network expansion where geographic focus is essential.
Usage Points
-
Main Usage
This slide effectively communicates your company's geographic business scope, market entry status, and customer distribution across global regions. The color-coded regional emphasis allows investors, partners, and stakeholders to instantly grasp which markets are primary, secondary, or emerging opportunities.
-
How to Use
Enter your presentation topic in the title area (e.g., Global Business Status, Market Expansion Strategy), then use the subtitle and descriptive text to explain regional characteristics. Customize the three legend boxes to define what each color represents—such as primary markets, growth regions, or new market entries—to enhance audience comprehension.
-
Recommended For
Ideal for global corporations presenting business reports, investor pitches, and market analysis. Particularly effective when explaining regional revenue distribution, customer concentration, and market entry timelines to executives, investors, and business partners seeking data-driven geographic insights.
-
Slide Structure
Each slide contains a title area (1 line), subtitle (1 line), descriptive text (2–3 lines), a central world map with 3-color regional emphasis, and three customizable legend boxes at the bottom. With 5 text input areas and 3 distinct map regions, the information hierarchy is clear and optimized for 16:9 aspect ratio.
Related Products
-

Country-by-Country Bar Chart Analysis – Market Trend Insights
#Company Introduction #Market and Competitor Analysis #Graph
-

Dawn City Theme Global Map
#Company Introduction #Market and Competitor Analysis #Other
-

Global Network Target Region Analysis – Stylish Design Visualization
#Company Introduction #Market and Competitor Analysis #Other
-

Global Target Country Map – Market Entry Strategy
#Company Introduction #Market and Competitor Analysis #Other
