Logistics Performance Comparison Chart – Market and Competitor Analysis
RJ0300043_8
- Last Update 04/29/2025
- File Size 3.3MB
- # of Slides 2
- File Format PPTX
- Slide Ratio 16:9
- Color
Keywords
- #Content-Based Slides
- #Design-Based Slides
- #Market and Competitor Analysis
- #Graph
- #Competitor Analysis
- #Market Analysis
- #Column
- #Grouped Column
- #16:9
- #grouped bar chart PowerPoint
- #column and bar chart template
- #logistics performance comparison slide
- #competitor analysis graph
- #2-series data visualization
- #bar chart PowerPoint slide download
About the Product
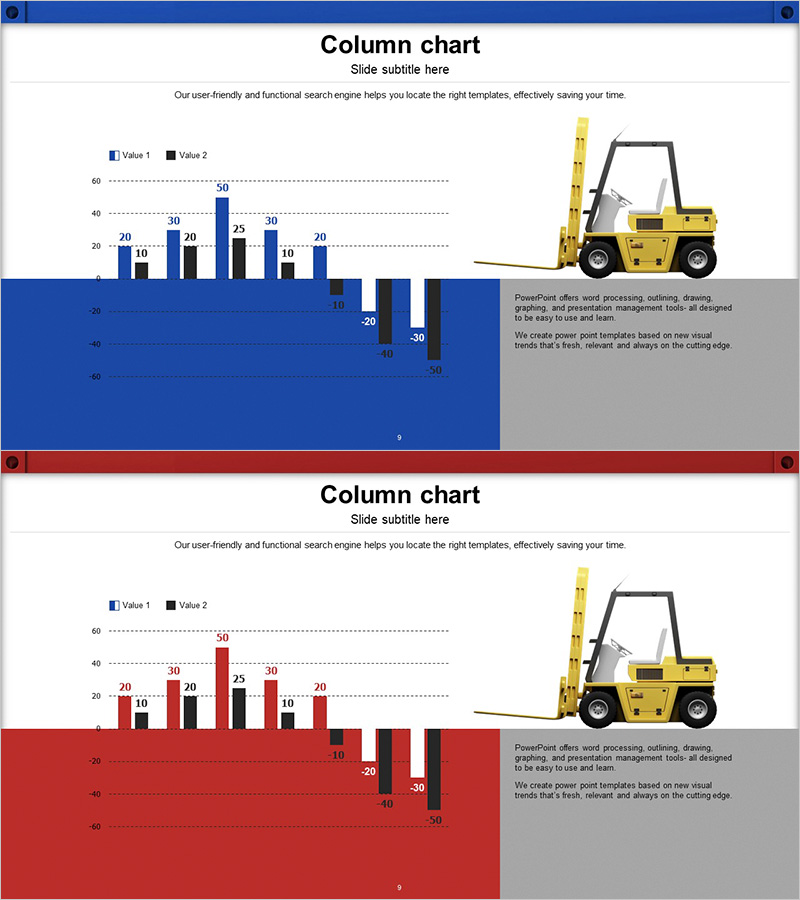
A two-slide PowerPoint presentation featuring grouped column and bar charts designed for logistics performance and competitor analysis. This slide deck provides dual data visualization methods—vertical columns and horizontal bars—optimized for numerical comparison and ranking visualization. Clear color differentiation using blue and red series makes Value 1 and Value 2 instantly recognizable, while gridlines and numeric labels support precise data interpretation. Ready to use in business presentations for market analysis, competitive benchmarking, and performance reporting.
Usage Points
-
Main Usage
Compare logistics performance metrics and competitor figures side-by-side to assess market position and competitive strength at a glance. The two-series data structure simultaneously represents dual indicators (e.g., company vs. competitor, target vs. actual) to enhance clarity in comparative analysis.
-
How to Use
Use the column chart when comparing multiple items vertically, and the bar chart when item names are lengthy or ranking emphasis is needed. Reference gridlines and numeric labels to communicate precise data values, and use the color legend (Value 1 and Value 2) to distinguish series.
-
Recommended For
Logistics and supply chain managers, business report writers, marketing strategy teams, sales performance analysts, and consulting professionals who need to present market conditions, competitive positioning, and performance trends with objective, persuasive data visualization.
-
Slide Structure
Slide 1: Blue-background grouped column chart with 6 items, 2 series, and negative value representation. Slide 2: Red-background grouped bar chart with identical 6 items, 2 series, and negative values. Each slide includes title, legend, gridlines, numeric labels, and right-side text description area.
Related Products
-

Layout Design Presentation Template - Column Charts
#Market and Competitor Analysis #Graph #Competitor Analysis
-

Vertical Bar Chart for Future Growth Prediction – Innovative Vision
#Market and Competitor Analysis #Graph #Competitor Analysis
-

Table chart & Clustered Column Graph – Market Analysis & Competitor Comparison
#Market and Competitor Analysis #Diagram #Graph
-

Grouped Bar Chart for Learning Categories
#Market and Competitor Analysis #Graph #Competitor Analysis
