Annual Logistics Volume Trend Line Chart
RJ0300043_16
- Last Update 04/29/2025
- File Size 3.3MB
- # of Slides 2
- File Format PPTX
- Slide Ratio 16:9
- Color
Keywords
- #Content-Based Slides
- #Design-Based Slides
- #Market and Competitor Analysis
- #Graph
- #Market Status
- #Competitor Analysis
- #Line
- #Line Chart
- #16:9
- #line chart PowerPoint
- #dual-series trend chart
- #logistics data visualization
- #how to create line chart in PowerPoint
- #5-year trend slide template
- #PowerPoint graph slide download
About the Product
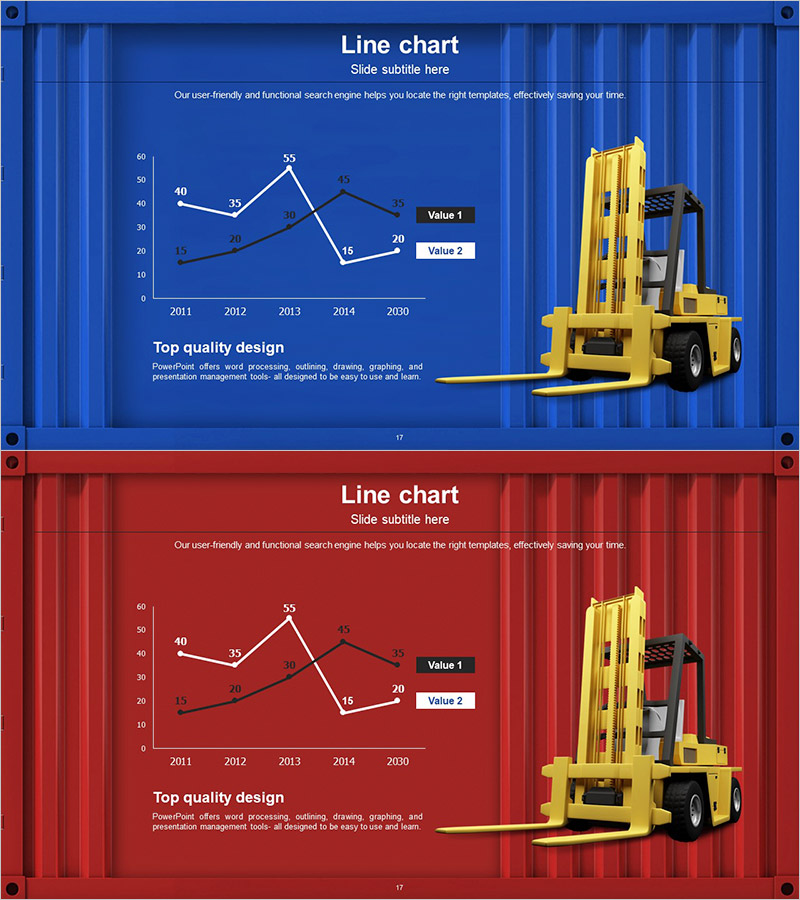
A PowerPoint slide template featuring a dual-series line chart that visualizes annual logistics volume trends from 2011 to 2030. The chart displays two data series (Value 1 and Value 2) using white and dark lines against a navy blue or deep red background. Each version includes five data points across the timeline, making it ideal for presenting comparative trends in logistics analysis, market performance, and sales forecasting. The slide is fully editable and ready to customize with your own data values and labels for business presentations, quarterly reports, and executive briefings.
Usage Points
-
Main Usage
Visualizes two-variable trends over time using a dual-line chart format, ideal for comparing logistics volumes, sales performance, or market metrics across five time periods. The clear data point markers and legend make trend analysis and year-over-year comparisons immediately apparent to your audience.
-
How to Use
Replace the sample data values (40, 35, 55, 43, 62, etc.) with your actual figures and update the legend labels from 'Value 1' and 'Value 2' to your specific metrics. Select either the navy blue or red background version to match your presentation theme, then adjust colors and fonts as needed.
-
Recommended For
Logistics and supply chain reports, quarterly sales performance reviews, market trend analysis presentations, investment pitch decks, management briefings, consulting proposals, and any business context requiring multi-series trend visualization over time.
-
Slide Structure
Dual-line chart with white and dark lines representing two data series, five data points along the x-axis (2011, 2012, 2013, 2014, 2030), legend box with Value 1 and Value 2 labels, title and subtitle areas, and descriptive text section for context.
Related Products
-

Graph of Usage Patterns by Year – Visualizing Market Conditions through Cluster Slides
#Market and Competitor Analysis #Diagram #Graph
-

Graph Comparing Transportation Methods – Market Overview Analysis
#Market and Competitor Analysis #Graph #Other
-

Comparison graph of broken lines by year – Market and Competitor Analysis
#Market and Competitor Analysis #Graph #Market Status
-

Car Wide Template Line Chart 2 – Market Analysis and Competitor Comparison
#Market and Competitor Analysis #Diagram #Graph
