Dual Column Chart by Quarter – Market Analysis and Competitive Advantage
RJ0300043_24
- Last Update 04/29/2025
- File Size 2.9MB
- # of Slides 2
- File Format PPTX
- Slide Ratio 16:9
- Color
Keywords
About the Product
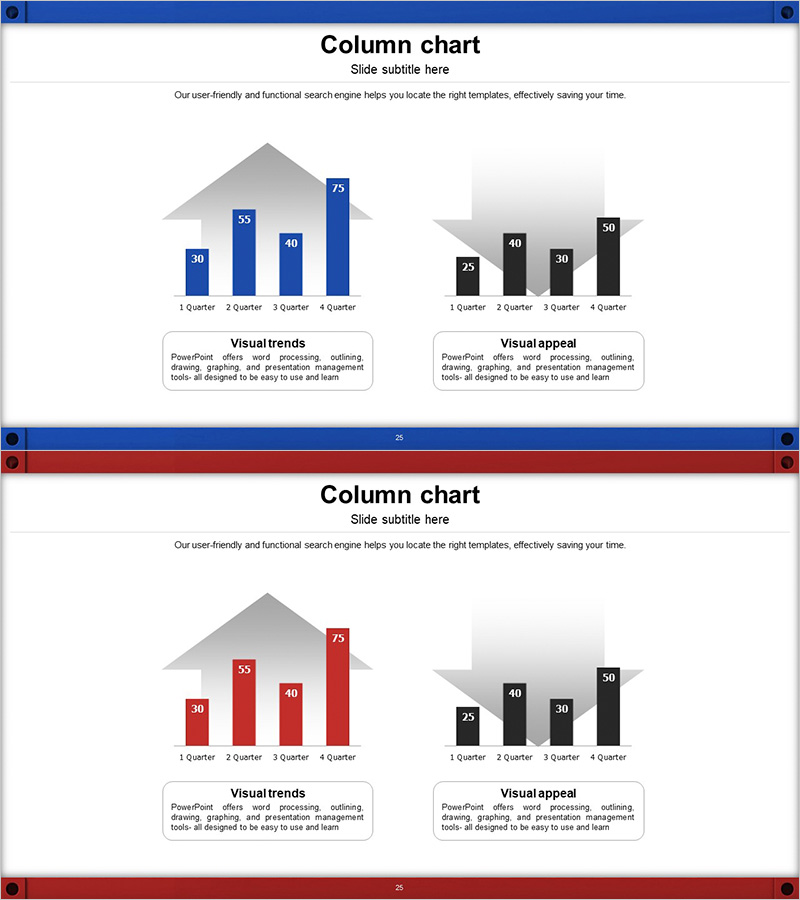
A dual-series column chart PowerPoint slide comparing quarterly performance across two data sets. The slide features blue and black color schemes with four quarters of data, each bar labeled with precise numerical values for accurate comparison. Ideal for business presentations including market analysis, competitive advantage evaluation, and quarterly performance reviews. The 2-slide set offers multiple color combinations that can be customized to match corporate branding. Each slide presents the same data structure with different color palettes, enabling flexible application across various presentation contexts.
Usage Points
-
Main Usage
Visualize and compare two data series across four quarters simultaneously, such as quarterly revenue, market share, or competitive metrics. The labeled values on each bar ensure precise numerical communication, while the color-coded series (blue and black) enable intuitive differentiation and analysis.
-
How to Use
Insert into business reports, marketing plans, or investor presentations within the performance analysis section to explain quarterly trends and competitive positioning. Select the appropriate color scheme from the 2-slide set to align with corporate branding, input your data, and deploy immediately as a presentation slide.
-
Recommended For
Recommended for executives, planning teams, sales teams, and analytics teams presenting quarterly results, market analysis, competitive positioning, investor relations, and performance reviews where comparative numerical analysis is essential.
-
Slide Structure
2-slide set with identical data structure but different color schemes. Each slide displays 4 quarters (Q1–Q4) with dual-series columns. First slide uses blue color palette; second uses black palette. Numerical labels appear above each bar for precise value reference and comparison across both series.
Related Products
-

Research Analysis Vertical Bar Chart
#Market and Competitor Analysis #Graph #Competitor Analysis
-

Competitor Analysis Bar Graph – Visualizing Market Competitive Advantages
#Market and Competitor Analysis #Graph #Competitor Analysis
-

Color Highlight Vertical Bar Graph – Market Competition Analysis
#Market and Competitor Analysis #Graph #Competitor Analysis
-

Comparative Analysis 3D Cylinder Bar Graph – Market and Competitor Analysis
#Market and Competitor Analysis #Graph #Competitor Analysis
