Maritime Freight Volume Chart – Understanding Marine Logistics Data
RJ0300043_14
- Last Update 04/29/2025
- File Size 3.3MB
- # of Slides 2
- File Format PPTX
- Slide Ratio 16:9
- Color
Keywords
- #Content-Based Slides
- #Design-Based Slides
- #Product/Service Introduction
- #Market and Competitor Analysis
- #Diagram
- #Product/Service Introduction
- #Market Analysis
- #Cluster
- #Closed Cluster Diagram
- #16:9
- #maritime infographic PowerPoint
- #cargo volume chart slide
- #shipping data visualization PPT
- #freight statistics presentation
- #container ship slide template
About the Product
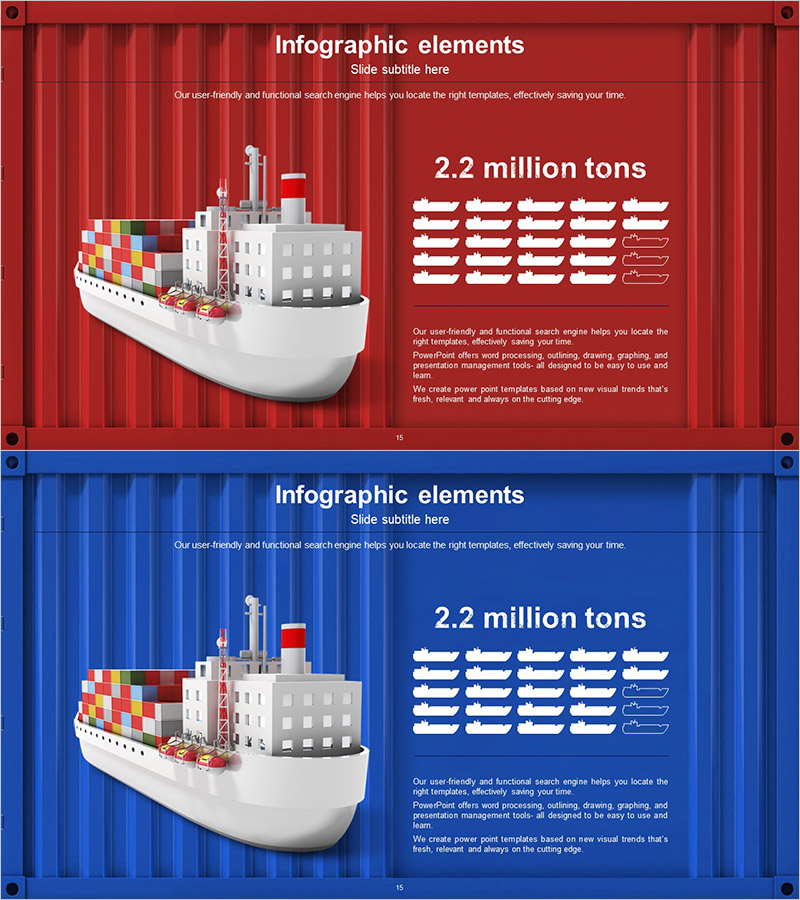
A professional PowerPoint slide featuring a 3D container ship mockup combined with a 20-item data bar chart for visualizing maritime freight volume and logistics statistics. Available in two color themes—red and blue—this slide design places the ship illustration on the left and corresponding cargo data bars on the right. Each data bar includes clearly marked input fields for real-time numerical entry, making it ideal for presenting shipping volumes, freight tonnage, trade statistics, and port performance. The two-slide set with color variations provides flexibility for multi-slide presentations, perfect for shipping companies, logistics firms, and maritime trade professionals.
Usage Points
-
Main Usage
Designed to communicate maritime shipping volumes, freight tonnage, and trade statistics with visual impact. The ship mockup paired with data bars effectively conveys the scale of ocean commerce, making it ideal for shipping companies, logistics providers, and maritime organizations presenting business performance and market data.
-
How to Use
Enter actual shipping volumes, cargo tonnage, or transaction values into the data bar input fields, and the visualization updates automatically. Use the red theme for performance-focused presentations and the blue theme for trust and stability messaging. Stack both slides sequentially for comparative analysis or trend demonstration across reporting periods.
-
Recommended For
Shipping companies, logistics firms, port authorities, trade associations, supply chain managers, maritime insurance professionals, and international business teams presenting operational metrics, quarterly shipping reports, global trade network overviews, and market share analysis.
-
Slide Structure
Left side features a 3D container ship mockup with warehouse building and cargo containers; right side displays 20 independent horizontal data bars with individual input fields. Title and subtitle area at top; descriptive text section at bottom. Both slides maintain identical layout with color variation (red/blue theme).
Related Products
-

Road Freight Volume Visualization Truck Graph – Logistics Market Analysis
#Product/Service Introduction #Market and Competitor Analysis #Diagram
-

Infographic Slide Template for Visualizing Air Cargo Volume
#Product/Service Introduction #Market and Competitor Analysis #Diagram
-

Cluster Diagram Introducing Korean Traditional Culture
#Product/Service Introduction #Diagram #Product/Service Introduction
-

Transportation Cargo Plan Diagram
#Product/Service Introduction #Diagram #Product/Service Introduction
