Port Transport Data & Comparison Chart – Optimized for Market and Competitor Analysis
RJ0300043_5
- Last Update 04/29/2025
- File Size 3MB
- # of Slides 2
- File Format PPTX
- Slide Ratio 16:9
- Color
Keywords
- #Content-Based Slides
- #Design-Based Slides
- #Product/Service Introduction
- #Market and Competitor Analysis
- #Graph
- #Development Status
- #Market Analysis
- #Column
- #Circles
- #Column Chart
- #Doughnut Chart
- #16:9
- #donut chart PowerPoint
- #pie chart slide template
- #comparison analysis graph
- #port transport data visualization
- #competitor analysis PowerPoint slide
About the Product
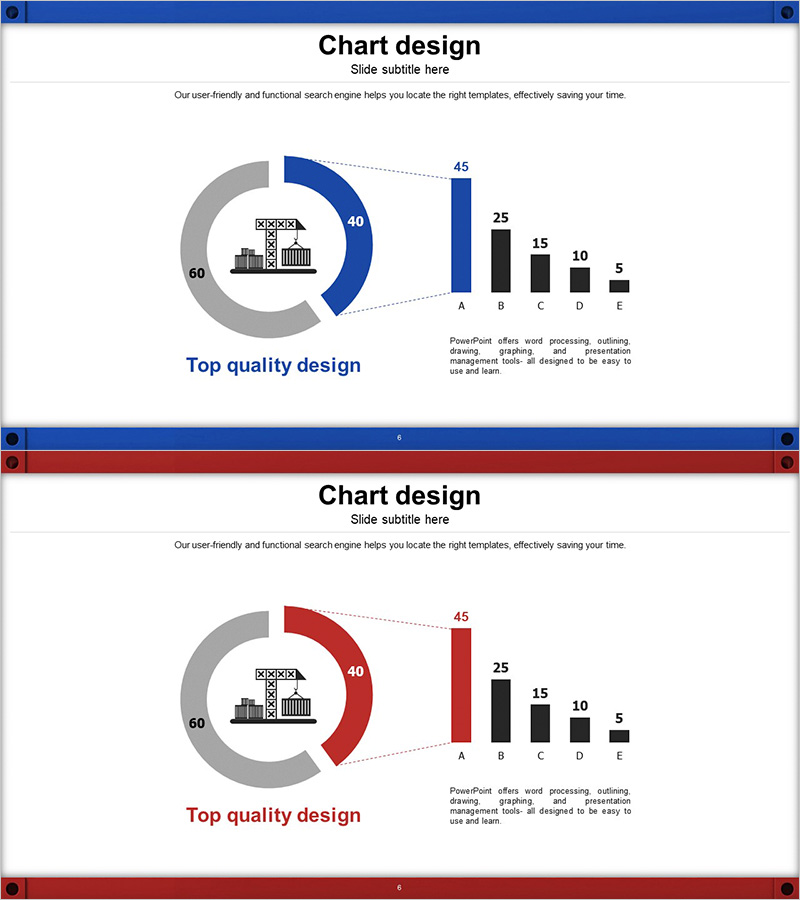
A PowerPoint slide template featuring a donut chart for port transport data analysis and market comparison. The design combines a central icon with an outer donut-shaped graph to intuitively represent market status and competitor benchmarking. Five data items are displayed in a horizontal bar chart (45, 25, 15, 10, 5) to emphasize numerical comparisons. The blue and red dual-tone color scheme creates strong visual contrast, optimized for 16:9 widescreen format across 2 slides. Ideal for logistics, maritime, and transportation industry presentations, with fully editable text and data fields for immediate use.
Usage Points
-
Main Usage
Used for data-driven presentations in maritime, logistics, and transportation industries. The donut chart displays overall composition ratios while the horizontal bar graph simultaneously visualizes detailed item-by-item numerical comparisons. The central icon (port facility building) emphasizes industry relevance and enhances audience comprehension.
-
How to Use
Apply this slide in business reports, market analysis documents, and competitor analysis sections when presenting data-driven decision-making content. Simply replace the donut chart segments and bar graph values with your actual data for immediate presentation use. Customize the blue and red colors to match your company brand guidelines for visual consistency.
-
Recommended For
Recommended for executive briefings at logistics, maritime, and transportation companies, investor presentations, and market analysis conferences. Ideal for consulting firms, financial institutions, and government agencies emphasizing data-driven policy decisions. Suitable for any industry requiring 5-item comparative analysis.
-
Slide Structure
Slide 1: Central icon (port building) + left-side donut chart (60% gray, 40% blue) + right-side horizontal bar graph with 5 items (A=45, B=25, C=15, D=10, E=5). Slide 2: Identical layout with donut chart color changed to red for enhanced comparative analysis effect. All numerical values and text fields are fully editable.
Related Products
-

Successful Data Analysis Donut Graph
#Product/Service Introduction #Market and Competitor Analysis #Graph
-

Development Status Analysis Donut-Shaped Circle Graph
#Product/Service Introduction #Market and Competitor Analysis #Graph
-

Businessman Cartoon Theme Circle Graph – Market Analysis and Competitiveness
#Product/Service Introduction #Market and Competitor Analysis #Graph
-

Detailed Analysis Circle Graph Presentation Template
#Product/Service Introduction #Market and Competitor Analysis #Graph
