Logistics Coverage Across the U.S.
RJ0300043_11
- Last Update 04/29/2025
- File Size 3MB
- # of Slides 2
- File Format PPTX
- Slide Ratio 16:9
- Color
Keywords
- #Content-Based Slides
- #Design-Based Slides
- #Market and Competitor Analysis
- #Marketing Plan and Strategy
- #Other
- #Target Market
- #Target Market Strategy
- #Map
- #16:9
- #U.S. map PowerPoint slide
- #logistics network presentation
- #regional analysis map slide
- #market analysis United States map
- #business presentation geography template
About the Product
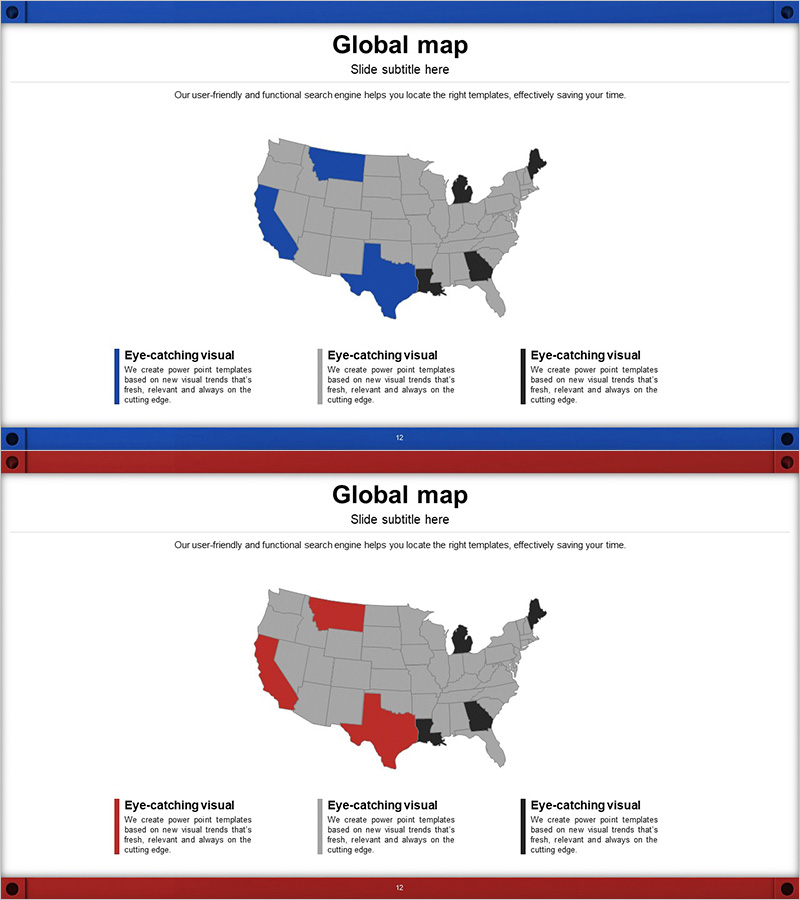
A geographic PowerPoint slide visualizing logistics network coverage across the United States with dual-color design options. This presentation slide features blue and red versions for comparative analysis and multi-scenario presentations. Each slide includes state-level data visualization areas and legend sections, making it ideal for marketing and strategic business presentations to clearly communicate regional coverage. The 16:9 widescreen format contains 2 slides ready for immediate editing and customization.
Usage Points
-
Main Usage
Visualize logistics distribution points and regional coverage across the United States to communicate clearly with investors, partners, and internal teams. The dual-color versions enable comparative analysis and scenario-based presentations, supporting market expansion strategies and regional business planning with data-driven evidence.
-
How to Use
Edit state regions by changing colors or adding data values to reflect current coverage status. Customize legend labels and numerical data in the bottom section, then add presentation context to title and subtitle areas. For comparative analysis, arrange both slides sequentially to maximize visual contrast and impact.
-
Recommended For
Logistics and distribution company operational briefings, marketing team regional strategy planning meetings, investor presentations explaining coverage expansion plans, consulting firm market analysis reports, and sales team regional performance analysis materials.
-
Slide Structure
Each slide contains title and subtitle areas at the top, a central U.S. map visualization with state-level color coding, and three legend explanation boxes at the bottom. The state-based color differentiation represents data hierarchy, with 5-6 editable text input areas enabling flexible customization.
Related Products
-

Analysis of US Target Regions - Effective Market Exploration
#Market and Competitor Analysis #Marketing Plan and Strategy #Other
-

Effective Slide Design for Analysis of Specific Regions in the U.S.
#Market and Competitor Analysis #Marketing Plan and Strategy #Other
-

Business USA Target Market Analysis – Predicting the Future with Data
#Market and Competitor Analysis #Marketing Plan and Strategy #Other
-

Asia-Focused Market Penetration Status - Data-Driven Market Analysis
#Market and Competitor Analysis #Marketing Plan and Strategy #Graph
