Logistics Factor Comparison Table – Intuitive Data Analysis
RJ0300043_17
- Last Update 04/29/2025
- File Size 3MB
- # of Slides 2
- File Format PPTX
- Slide Ratio 16:9
- Color
Keywords
About the Product
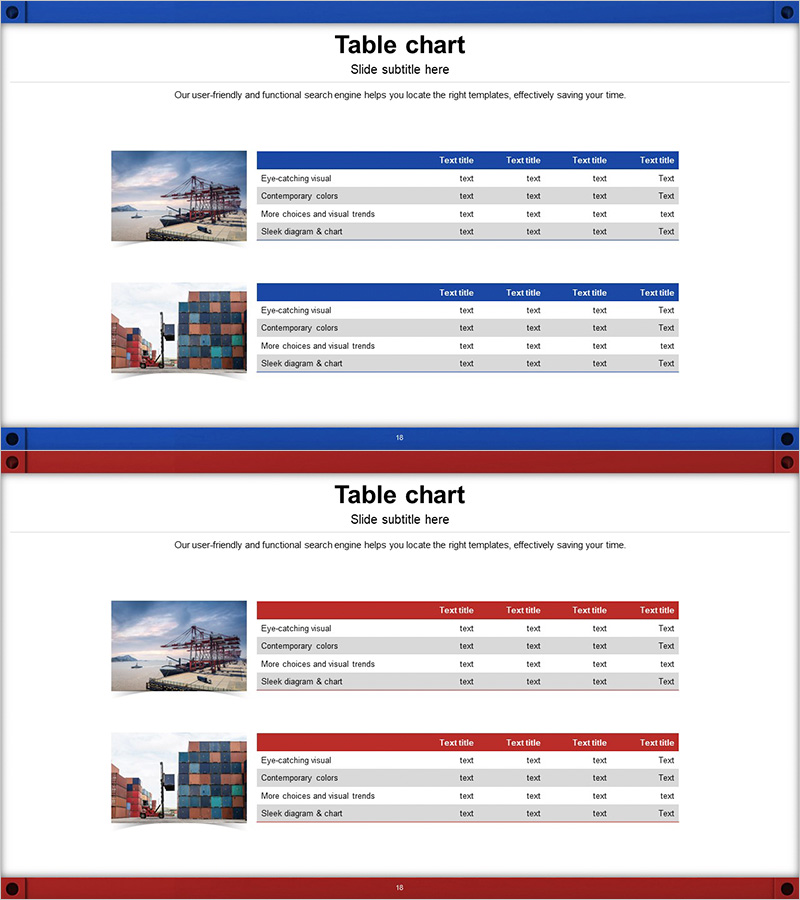
A 4-column comparison table PowerPoint slide designed for logistics metrics and financial data analysis. This 2-slide deck features a dark blue header row and light gray data cells that clearly establish information hierarchy. The left side accommodates an image or visual reference, while the right side displays the structured table, enabling simultaneous presentation of visual context and numerical data. Ideal for supply chain performance reports, cost analysis presentations, and financial planning documents that require systematic data comparison.
Usage Points
-
Main Usage
Present multi-item data such as logistics indicators, financial metrics, or performance benchmarks in a structured table format. The left image area provides context while the right table delivers specific numerical data, enabling clear comparative analysis for business decision-making.
-
How to Use
Insert into business reports, financial analysis presentations, or supply chain performance reviews in the metrics comparison or analysis section. Edit header text and data cells with your own items and figures; replace the left image with relevant photography to reinforce context and improve visual engagement.
-
Recommended For
Logistics managers, financial analysts, business planners, and executives preparing data-driven reports. Suitable for cost comparisons, performance benchmarking, market research summaries, and any business presentation requiring quantitative information delivery and systematic data organization.
-
Slide Structure
2-slide layout with left image area (approximately 30%) and right table section (approximately 70%). Each table features a dark blue header row and four light gray data rows, with all cells editable for custom content. Clear color differentiation between header and data rows emphasizes information hierarchy and improves readability.
Related Products
-

Blue Line Wide Template Table1
#Financial Plans and Performance #Diagram #Sales and Revenue
-

Farm Key Financial Indicators Table Chart – Intuitive Presentation of Financial Performance
#Financial Plans and Performance #Diagram #Sales and Revenue
-

Effective Data Table Slide – Financial Planning and Performance
#Financial Plans and Performance #Diagram #Sales and Revenue
-

Blue Green Climbing Table Chart – Visualization of Financial Performance
#Financial Plans and Performance #Diagram #Sales and Revenue
