Visualizing Business Strategy with Connected Circular Infographic
RJ0300043_20
- Last Update 04/29/2025
- File Size 2.9MB
- # of Slides 2
- File Format PPTX
- Slide Ratio 16:9
- Color
Keywords
- #Content-Based Slides
- #Design-Based Slides
- #Business Strategy
- #Business Management
- #Diagram
- #Step-by-Step Schedule Plan
- #Implementation Plan
- #Cluster
- #Chain Diagram
- #16:9
- #circular diagram PowerPoint
- #connected infographic slide
- #4-step process diagram
- #cycle diagram PowerPoint template
- #business strategy visualization slides
About the Product
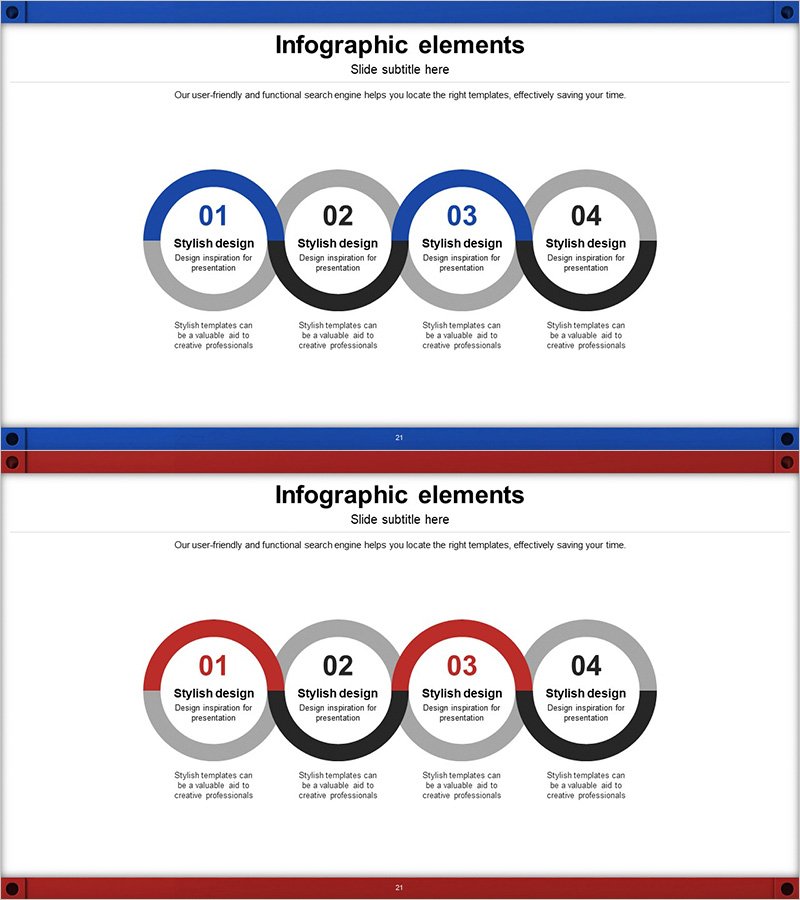
A PowerPoint slide featuring four circular nodes connected in a cyclical structure with blue and red dual-tone color scheme. Each node alternates between blue and gray/red and black accents, making it ideal for visualizing business strategy, phased timelines, and process flows. The design includes numbered nodes with title and description areas beneath each circle, ready for immediate use in strategy sections of company presentations, business plans, and marketing proposals. Provided in 16:9 widescreen PPTX format with fully editable text and colors.
Usage Points
-
Main Usage
Breaks down business strategy, phased processes, and cyclical workflows into four distinct stages with clear visual connections. Effectively communicates the relationship and flow between stages, enhancing audience comprehension of strategic planning, execution roadmaps, and performance management cycles.
-
How to Use
Insert into company presentation vision/strategy sections, business plan strategy pages, marketing proposal campaign phases, or report process explanations. Customize by replacing node numbers, titles, and description text with your content. Adjust colors as needed to align with corporate branding guidelines.
-
Recommended For
Executives, strategy managers, marketing teams, project managers, and consultants presenting strategic plans, execution timelines, and performance cycles. Particularly effective for emphasizing cyclical workflows, continuous improvement processes, and phased project schedules.
-
Slide Structure
Two-slide set. First slide features blue-tone 4-step circular diagram with numbered nodes (01–04) in alternating gray and black circles. Second slide presents identical structure with red-tone color scheme. Each node contains a centered number field and descriptive text area below.
Related Products
-

Conveyor Arrow Process Diagram
#Business Strategy #Business Management #Diagram
-

Mountain Climbing Aftercare and Maintenance Plan
#Business Strategy #Business Management #Diagram
-

3STEP Diagram – Effective Visualization of Business Strategy
#Business Strategy #Business Management #Diagram
-

Step-by-Step Schedule Diagram – Business Strategy and Management
#Business Strategy #Business Management #Diagram
