
Smart Health Care Presentation – Ideal Design for Health Management
J0600017
- Last Update 01/09/2025
- File Size 24.9MB
- # of Slides 35
- File Format PPTX
- Slide Ratio 16:9
- Color
Slide Preview


Keywords
About the Product
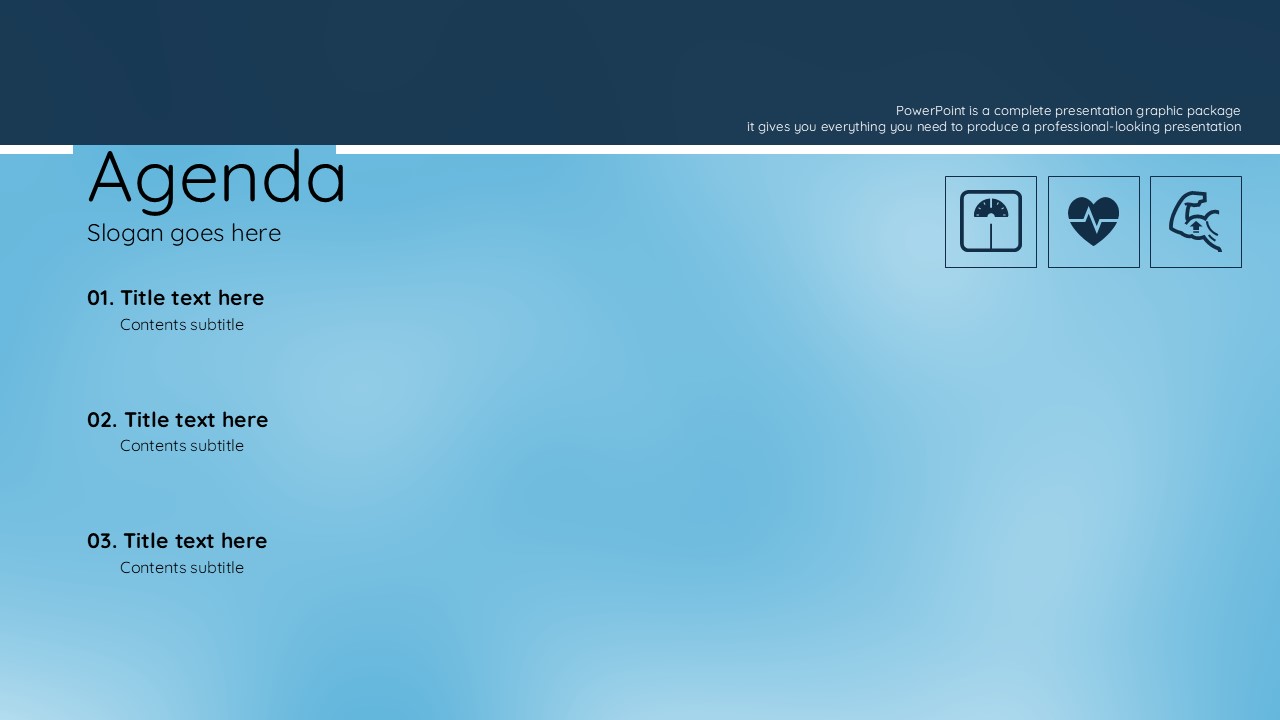
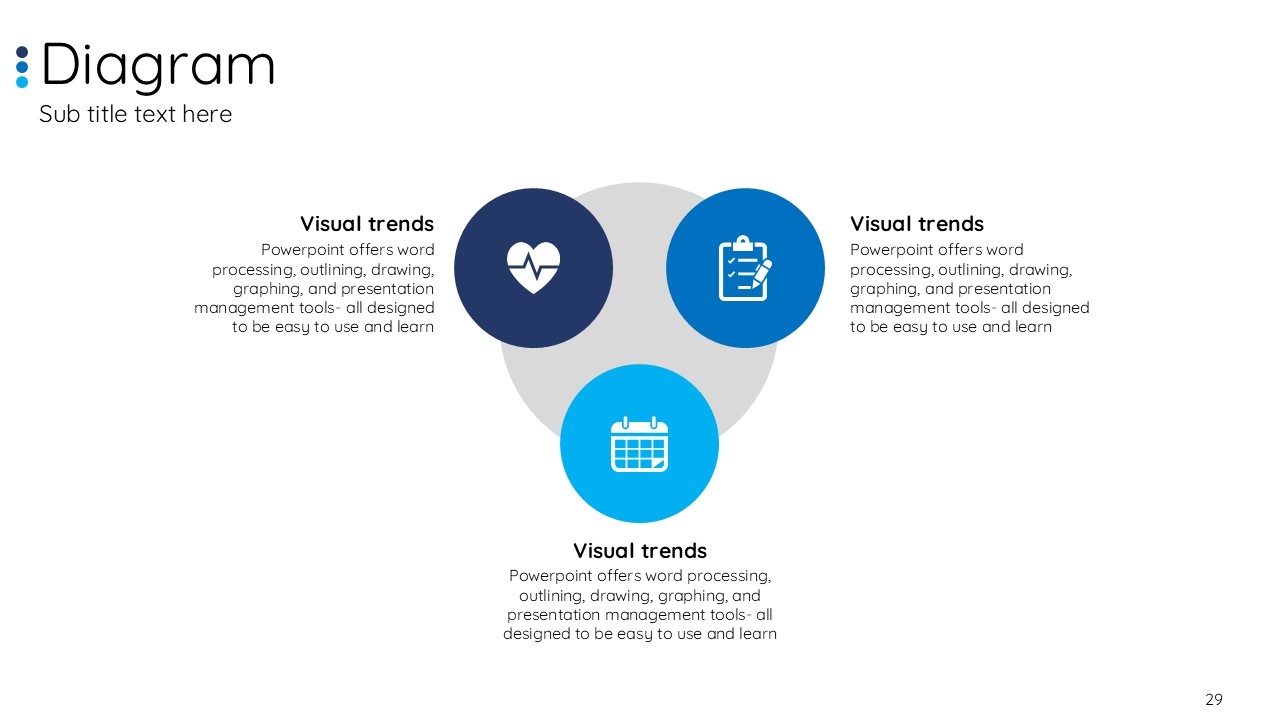
A professional healthcare PowerPoint template featuring a sky-to-deep-blue gradient background combined with real fitness and running photography. This 35-slide deck covers every slide type needed for health management presentations: title slide, section dividers, system flow diagrams, infographics, pyramid diagrams, and pie charts. Data visualization slides incorporating human body silhouettes, pictogram icons, and multi-segment pie charts make it easy to communicate health statistics and wellness metrics at a glance. The template is immediately editable in PPTX format — simply replace placeholder text, numbers, and images with your own content. A consistent cyan accent color and line-style icon set run throughout all slides, giving the entire presentation a cohesive, trustworthy medical-industry look. Ideal for hospital pitches, fitness app launches, healthcare startup investor decks, and corporate wellness campaigns.
Usage Points
-
Main Usage
Designed for healthcare startups, hospitals, fitness brands, and wellness companies to create professional presentations for service introductions, investor pitches, health data reports, and corporate wellness campaigns.
-
How to Use
Open the PPTX file, update the title and slogan on the cover slide, then replace the placeholder numbers in pie chart and infographic slides with your actual health data. Background photos on section divider slides can also be swapped to match your brand imagery.
-
Recommended For
Healthcare startup founders, hospital marketing teams, fitness app and wearable device companies, health campaign planners, and IR managers preparing investor decks for medical service businesses will find this template especially useful.
-
Slide Structure
Includes a 3-panel fitness photo cover with blue gradient, section dividers with full-bleed photography and cyan text boxes, icon-based system flow diagrams, human silhouette infographics with pie charts and pictograms, pyramid diagrams with line icons, and dual pie chart + data table slides — 35 slides total.


