Blue Green Basic Line Chart – Market Status and Competitive Analysis
RJ0600017_13
- Last Update 06/25/2025
- File Size 0.2MB
- # of Slides 2
- File Format PPTX
- Slide Ratio 16:9
- Color
Keywords
About the Product
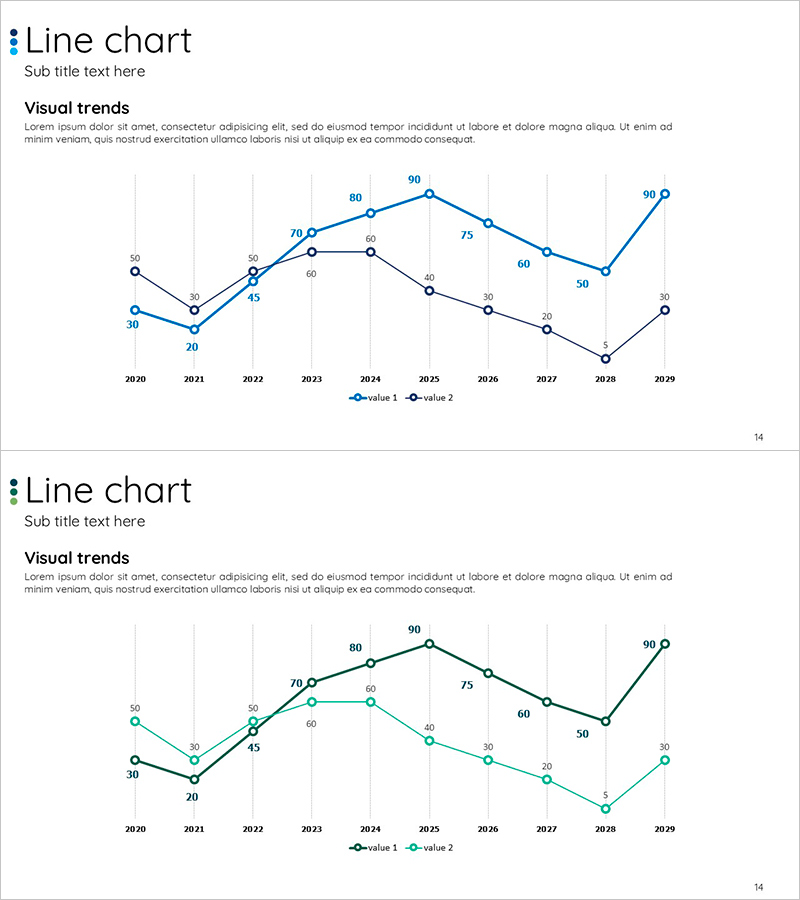
A dual-series line chart PowerPoint slide designed for market status and competitive analysis presentations. The blue and green color scheme clearly distinguishes two data series, visualizing 10-year trends from 2020 to 2029. The grid background and labeled data points enable precise value reading, making this presentation template immediately applicable to reports and business decks. Provided in 16:9 widescreen PPTX format with fully editable colors and numerical values for customization.
Usage Points
-
Main Usage
Optimized for comparing and analyzing two data series over time. Effectively displays market trends, competitor benchmarking, revenue progression, growth rate comparisons, and other business metrics simultaneously. Provides visual evidence for data-driven decision-making and strategic planning.
-
How to Use
Integrate into business plans, investor pitch decks, quarterly reports, and marketing strategy presentations within market analysis sections. The ascending, descending, and fluctuating line patterns intuitively convey trends, helping audiences grasp data changes effortlessly. Input actual data and use immediately in presentations.
-
Recommended For
Ideal for executives, marketing managers, financial analysts, management consultants, and sales leaders who require data-driven reporting and analysis. Particularly effective for market trend analysis, competitive advantage explanation, and performance progress reporting.
-
Slide Structure
Two-slide set, each containing a dual-series line chart. Blue and green lines distinguish the two data series with numerical values displayed at each data point. The horizontal axis represents years (2020–2029) and the vertical axis shows value range (0–100). Includes legend and title areas for context and clarity.
Related Products
-

Work Stress Visualized with Line Chart – Analysis and Competitive Advantage
#Market and Competitor Analysis #Graph #Market Status
-

Vegetable Market Status Analysis with Line Charts
#Market and Competitor Analysis #Graph #Market Status
-

Line Graph for Market Trends Visualization – Competitive Advantage Analysis
#Market and Competitor Analysis #Graph #Market Status
-

Line Graph for Camping Market Analysis – Market Trends and Competitive Advantage
#Market and Competitor Analysis #Graph #Market Status
