Human Details Infographic Chart – Customer Analysis and Market Overview
RJ0600017_15
- Last Update 06/25/2025
- File Size 0.3MB
- # of Slides 2
- File Format PPTX
- Slide Ratio 16:9
- Color
Keywords
- #Content-Based Slides
- #Design-Based Slides
- #Market and Competitor Analysis
- #Graph
- #Other
- #Customer Analysis
- #Market Overview
- #Column
- #Other
- #Column Chart
- #Other Charts
- #Silhouette
- #16:9
- #human silhouette infographic PowerPoint
- #customer analysis slide template
- #market overview chart
- #demographic analysis presentation
- #infographic slide design PowerPoint
About the Product
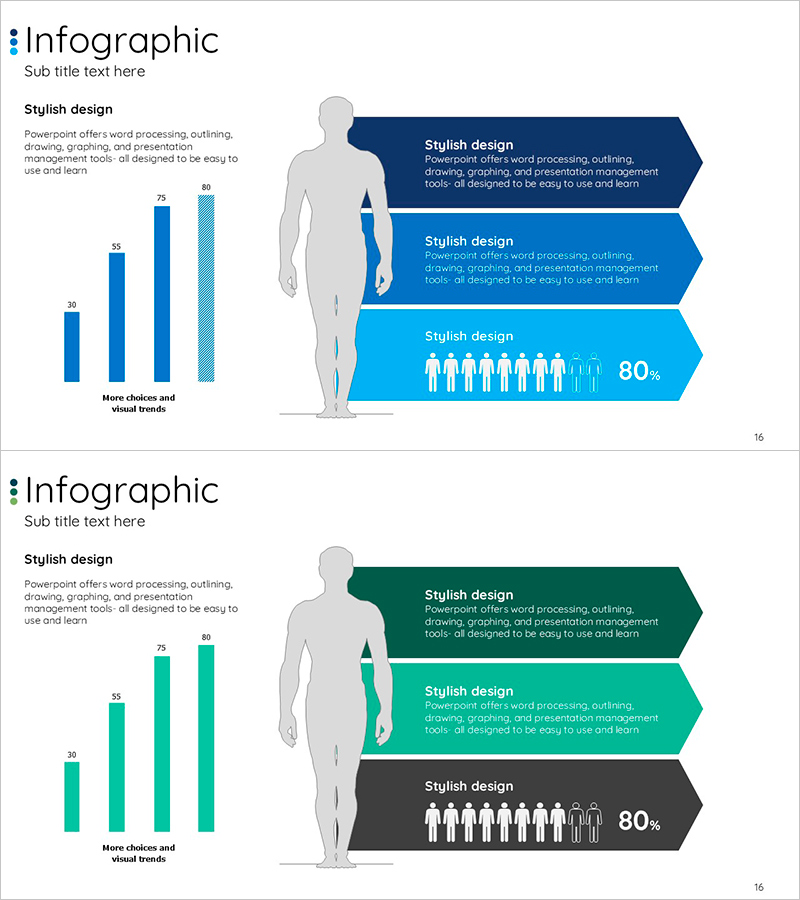
Customer analysis and market overview infographic PowerPoint slide featuring human silhouette visualization. The slide combines a vertical bar chart on the left with a three-level arrow callout layout positioned over a human figure silhouette on the right, enabling intuitive representation of customer segmentation, market composition, and demographic analysis. Available in three color schemes—dark blue, light blue, and green—each slide is ready for immediate use in data-driven presentations. Optimized for customer profile sections in business reports, market analysis decks, and marketing strategy presentations.
Usage Points
-
Main Usage
Simultaneously express customer segmentation, demographics, and market composition using human silhouette and data visualization to convey target audience insights intuitively. Ideal for business reports, marketing strategy presentations, and customer analysis decks where visual impact on key findings is essential.
-
How to Use
Input actual customer metrics into the left vertical bar chart and populate the three-level arrow callouts over the human silhouette with segment names, characteristics, and percentages. Select color scheme (blue or green) to match brand guidelines, then add icons, figures, and percentage labels to complete the visualization.
-
Recommended For
Marketing teams, sales departments, and executives presenting customer analysis results. Effective for new business planning, market entry strategy, and customer satisfaction survey presentations. Well-suited for consulting, research, financial services, and consumer goods industry presentations.
-
Slide Structure
Two-slide set. Each slide features a left-side vertical bar chart with four items (values 30, 55, 75, 80), and right-side human silhouette with three-level arrow callouts (dark blue, light blue, light blue or dark green, light green, dark gray color options) and 80% percentage indicator with icon.
Related Products
-

Bar Graph Visualizing Elderly Population Ratio
#Market and Competitor Analysis #Graph #Other
-

Customer Analysis People Icon Graph – Insights and Data Visualization
#Market and Competitor Analysis #Graph #Customer Analysis
-

Business Forest Wide Template Map – Tool for Market and Competitor Analysis
#Market and Competitor Analysis #Other #Customer Analysis
-

Newspaper Wide PowerPoint Template Diagram7 – Visual Storytelling for Data Analysis
#Product/Service Introduction #Market and Competitor Analysis #Other
