Arrow Step-by-Step Diagram for Presentation Visualization – Process and Flow
RJ0600017_21
- Last Update 06/25/2025
- File Size 0.1MB
- # of Slides 2
- File Format PPTX
- Slide Ratio 16:9
- Color
Keywords
About the Product
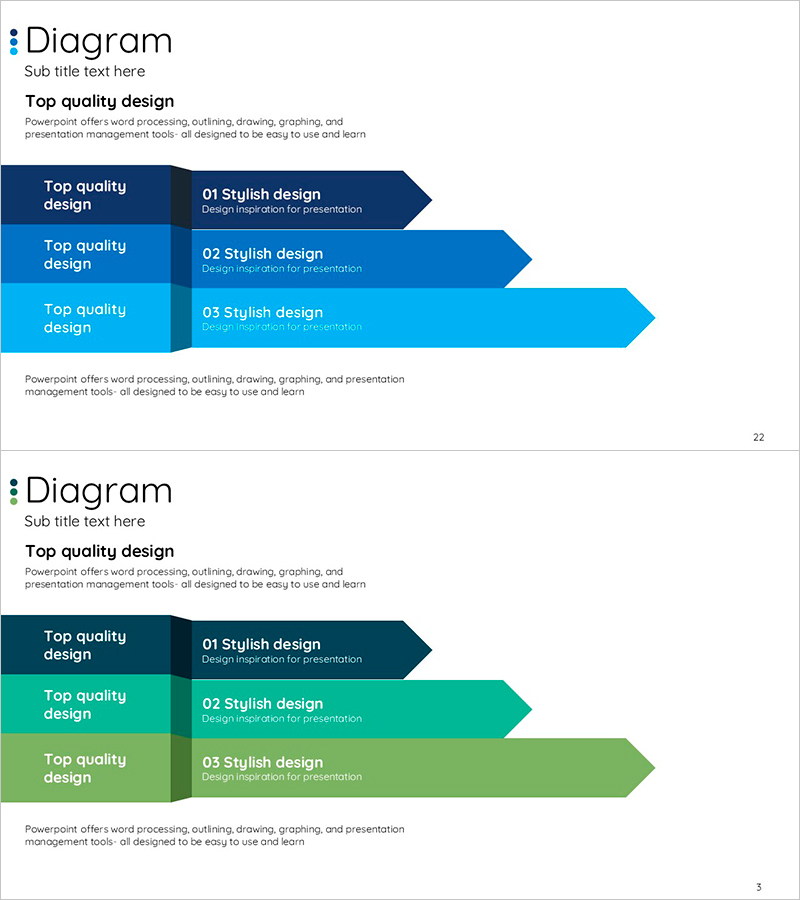
A 3-step arrow flow diagram PowerPoint slide that visualizes sequential processes and stage-by-stage progression. Three arrows transition from dark navy to light sky blue in a gradient effect, each connected to a label box on the left side for clear hierarchical flow representation. Each step includes editable title and description text areas, making it instantly applicable to business processes, project timelines, strategic phases, and operational procedures. The 2-slide set offers color variations (blue and green gradients) to match your presentation's tone and branding.
Usage Points
-
Main Usage
Optimized for visualizing sequential stages in processes, strategies, and operational procedures. The hierarchical arrangement of left-side label boxes and right-side 3-arrow progression enables instant comprehension of step order and importance, making it highly effective for business presentations, project planning, and organizational workflow explanations.
-
How to Use
Enter stage names (Step 1, Step 2, Step 3 or Planning, Execution, Evaluation) in the title area of each arrow box, then add detailed descriptions in the text field below. Choose between two color variations (blue or green gradient) to match your presentation's brand colors or section themes.
-
Recommended For
Ideal for executives, planners, project managers, and training professionals who need to explain stage-by-stage progression. Applicable across business plans, reports, proposals, training materials, and any document requiring emphasis on sequential phases and structured workflows.
-
Slide Structure
2-slide set, each containing 3 arrow nodes. Left-side label boxes (dark navy, medium blue, light sky blue) connect to progressively longer arrows extending rightward, emphasizing forward flow direction. Optimized for 16:9 widescreen format with fully editable text and color elements.
Related Products
-

Animal Nature Conservation Program Future Plan Roadmap
#Product/Service Introduction #Diagram #Product/Service Introduction
-

Key Customer Comparison Analysis Slide – Client Success Stories and Data Visualization
#Customer Success Stories #Diagram #Graph
-

Business Market Analysis Bar Graph – Visualizing Competitive Analysis
#Market and Competitor Analysis #Diagram #Graph
-

Visualizing Business Strategy with Key Plan Roadmap – A Journey to Success
#Business Strategy #Operational Plan #Diagram
