Graph of Analysis by Year in the Americas – Infrastructure and Business Strategy
RJ0600017_18
- Last Update 08/28/2025
- File Size 0.3MB
- # of Slides 2
- File Format PPTX
- Slide Ratio 16:9
- Color
Keywords
About the Product
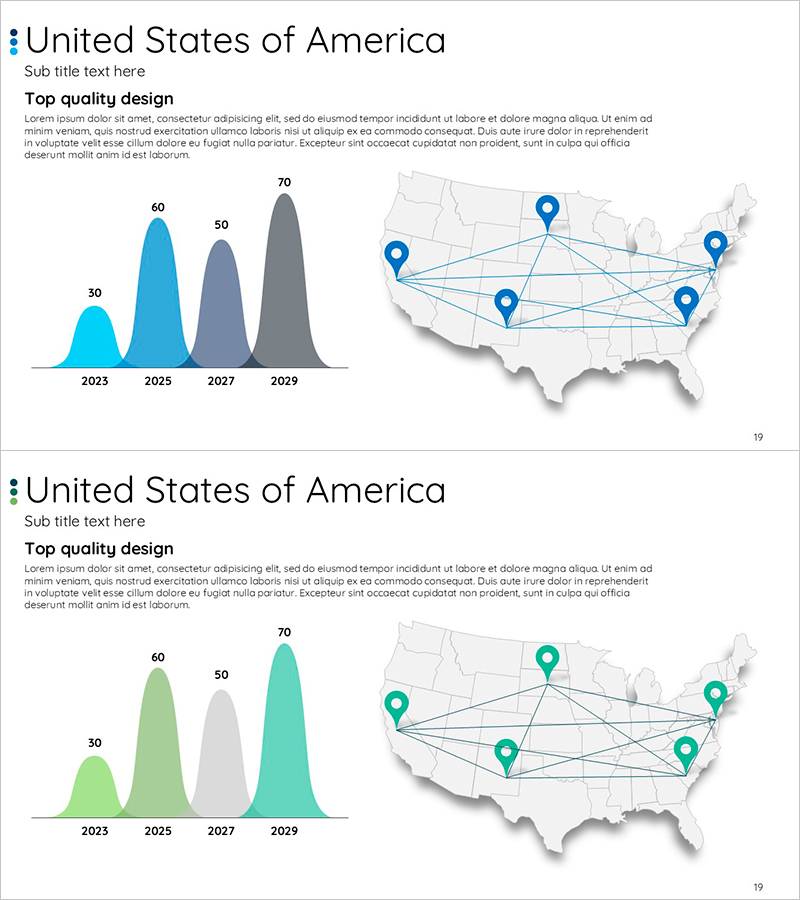
A 2-slide PowerPoint presentation visualizing year-over-year data analysis for the Americas region. The left-side trend graph displays numerical changes across four years (2023–2029) in four distinct colors (light blue, sky blue, navy, charcoal), while the right-side Americas map marks six regional hubs with pins and network connection lines to illustrate inter-regional relationships. Text input areas include title, subtitle, and body description sections, making it immediately applicable for business strategy, infrastructure status, and business introduction presentations. Delivered in 16:9 widescreen PPTX format, fully editable in all PowerPoint versions.
Usage Points
-
Main Usage
Simultaneously present year-over-year growth trends and regional hub distribution across the Americas to effectively communicate business expansion plans, infrastructure investment status, and region-specific marketing strategies. The dual-structure layout of trend graph and map combines quantitative data with geographic context for compelling storytelling.
-
How to Use
Deploy in business introduction presentations as a market analysis section, use in investor pitch decks for regional strategy slides, or incorporate into infrastructure and logistics reports for hub distribution explanations. Replace graph values and map locations with your own data for immediate presentation-ready output.
-
Recommended For
Global business managers, regional strategy planning teams, infrastructure and logistics companies, investor relations professionals, and marketing strategy departments. Ideal for any presentation scenario requiring explanation of Americas regional business status.
-
Slide Structure
Both slides 1 and 2 share identical layout: title and subtitle input areas at top, left-side 4-year trend graph with editable data values, right-side Americas map with 6 regional hub pins and network connection lines, and body description text area at bottom. Consistent color scheme maintains visual unity when presenting both slides sequentially.
Related Products
-

Infrastructure and Regional Marketing Strategies – Data Visualization Template
#Company Introduction #Business Introduction #Graph
-

Cluster Diagram Visualizing Korea's Network
#Company Introduction #Business Introduction #Diagram
-

Visualizing South Korea's Market Share – Data-Driven Insights
#Company Introduction #Market and Competitor Analysis #Graph
-

Visualizing Local Routes in a Business Diagram
#Company Introduction #Business Introduction #Diagram
