Silhouette and Infographic – Effective Use in Market and Customer Analysis
RJ0600017_6
- Last Update 06/25/2025
- File Size 0.2MB
- # of Slides 2
- File Format PPTX
- Slide Ratio 16:9
- Color
Keywords
About the Product
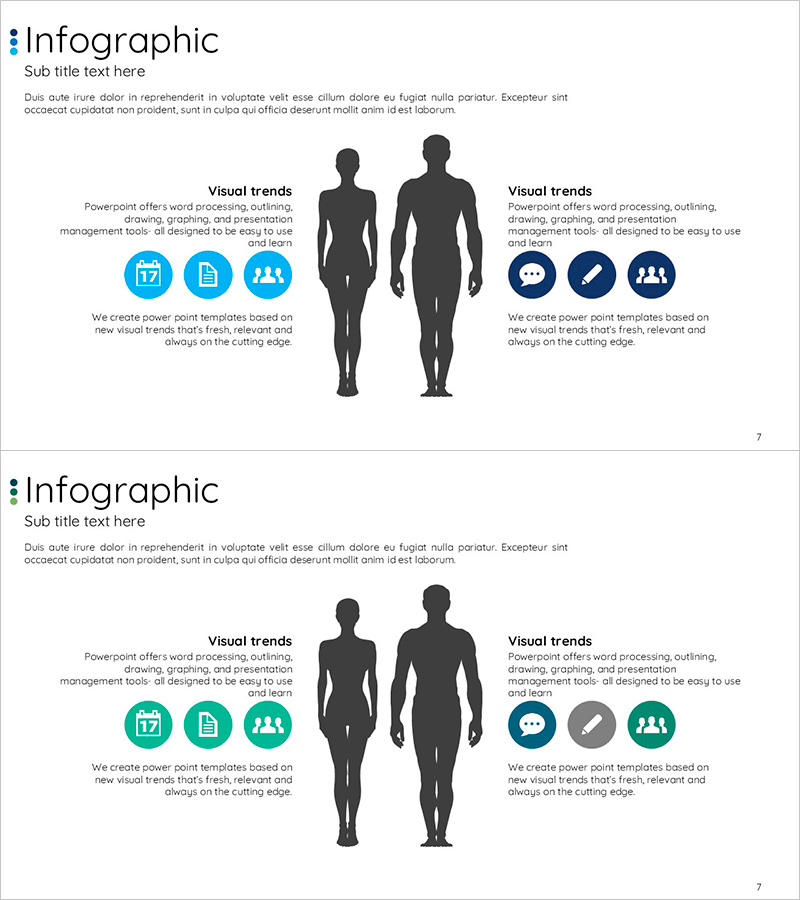
A two-slide PowerPoint presentation featuring male and female silhouettes in a symmetrical left-right comparison layout. Optimized for market analysis, customer segmentation, and demographic targeting presentations. Each side displays three icons in blue, turquoise, and gray tones to represent information hierarchy and key attributes. Ample text input areas enable immediate customization for audience analysis, competitive positioning, and customer persona development. The balanced visual structure supports side-by-side data comparison and insight communication.
Usage Points
-
Main Usage
Visually compare and contrast two customer groups, market segments, or demographic profiles in market analysis and customer research presentations. The silhouette-based design with icon integration clarifies information hierarchy and strengthens decision-making insights.
-
How to Use
Enter group characteristics, behavioral patterns, and customer needs in the left and right text areas. The three icons on each side represent category strengths or key attributes; adjust colors to indicate priority levels. Use in executive briefings, marketing strategy presentations, and business development meetings.
-
Recommended For
Marketing managers, business strategists, product teams, and market researchers presenting customer segmentation, competitive analysis, and targeted marketing strategies. Particularly effective for B2B proposals, investor presentations, and strategic planning sessions.
-
Slide Structure
Two-slide deck with symmetrical left-right layout centered on male and female silhouettes. Each slide contains three icons per side plus dedicated text input areas for attributes and descriptions, with separate title and subtitle zones for customization.
Related Products
-

Business Partner Customer Reviews – Simple and Stylish Design
#Market and Competitor Analysis #Customer Success Stories #Diagram
-

Optimized Template for Presentations – Efficient Information Delivery
#Market and Competitor Analysis #Customer Success Stories #Text Box
-

Coffee Bean Infographic - Capturing Visual Appeal
#Market and Competitor Analysis #Other #Customer Analysis
-

User Analysis Graph Visualization – Market and Customer Insights
#Market and Competitor Analysis #Graph #Other
