Sports Future Expected Effects and Numerical Graphs
RJ0600017_25
- Last Update 08/28/2025
- File Size 0.2MB
- # of Slides 2
- File Format PPTX
- Slide Ratio 16:9
- Color
Keywords
About the Product
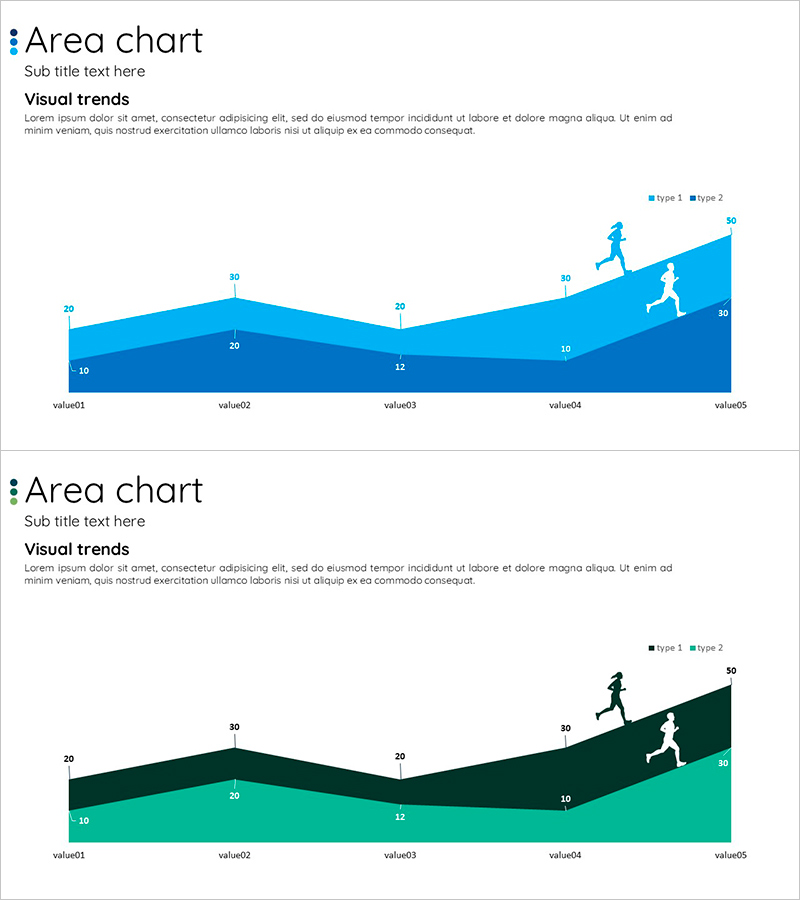
A multi-layered area chart PowerPoint slide designed to visualize data trends over time with two distinct categories. The blue and green dual-tone color scheme clearly differentiates Type 1 and Type 2 data series, while numerical values are displayed at each data point for precise interpretation. Ample space for title, subtitle, and descriptive text makes this slide immediately applicable to market analysis, performance tracking, and competitive positioning presentations. Formatted in 16:9 widescreen PPTX for seamless compatibility with modern presentation environments.
Usage Points
-
Main Usage
Simultaneously compare and visualize trends of two or more data series over time. Precise numerical values at each point strengthen data credibility in presentations to investors, partners, and executives, supporting data-driven decision-making.
-
How to Use
Enter your analysis topic in the title area (e.g., market growth rate, sales trends, customer satisfaction). Add the time period or comparison subject in the subtitle. Update the data values, and the area chart automatically reflects your changes with legend and labels intact.
-
Recommended For
Ideal for business plans, investor pitch decks, quarterly performance reports, market analysis documents, competitive benchmarking, and marketing strategy presentations. Recommended for executives, finance teams, marketing professionals, and strategic planners who need to communicate data-driven insights.
-
Slide Structure
Structured with title and subtitle area at the top (2 lines), a central dual-layer area chart with legend and numerical labels, and descriptive text space at the bottom. The blue and green color scheme intuitively separates the two data series, while data point labels ensure accurate information delivery.
Related Products
-

Business Analysis Chart – Visualizing Competitive Advantage
#Market and Competitor Analysis #Graph #Other
-

Comparison Bar Chart for Market Competition Analysis – Competitive Advantage
#Market and Competitor Analysis #Graph #Other
-

Highlight Area Chart and Brief Message – Market Analysis Insights
#Market and Competitor Analysis #Graph #Other
-

Visualizing Experimental Results with Bar Chart Slide
#Product/Service Introduction #Market and Competitor Analysis #Graph
