Segmented Horizontal Bar Charts and Tables – Optimal Data Visualization for Market Analysis
RJ0600017_32
- Last Update 06/25/2025
- File Size 0.2MB
- # of Slides 2
- File Format PPTX
- Slide Ratio 16:9
- Color
Keywords
- #Content-Based Slides
- #Design-Based Slides
- #Market and Competitor Analysis
- #Diagram
- #Graph
- #Market Analysis
- #Table
- #Horizontal Bar
- #Segmented Horizontal Bar
- #16:9
- #segmented horizontal bar chart PowerPoint
- #market analysis slide template
- #comparative data visualization
- #bar chart and table template
- #competitive analysis presentation
About the Product
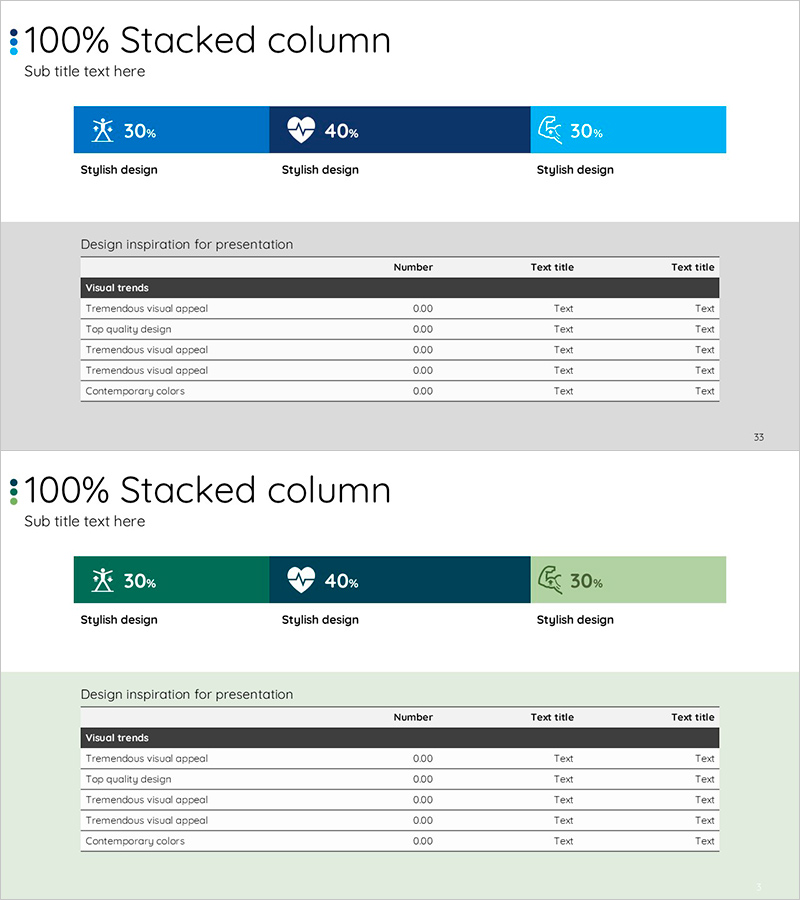
A 2-slide PowerPoint presentation optimized for market analysis and comparative data visualization, featuring a segmented horizontal bar chart and comprehensive data table. The first slide displays 5 items across 3 data series in a segmented horizontal bar format, ideal for competitive benchmarking, market share comparison, and product performance metrics. The second slide provides a structured data table that complements the visual chart with detailed figures, descriptions, and supporting information. The cohesive blue color palette—combining navy, medium blue, and light blue tones—reinforces professional credibility. Both slides are ready to integrate into presentations and reports with minimal customization.
Usage Points
-
Main Usage
Communicate market analysis, competitive positioning, and product performance metrics through a 3-series segmented horizontal bar chart, supported by a detailed data table that reinforces quantitative credibility. Suitable for any presentation requiring side-by-side numerical comparison.
-
How to Use
Double-click the bar chart values on slide 1 to edit figures and adjust legend colors. On slide 2, select table cells to input text and numerical data. Insert into business plans, marketing proposals, quarterly reports, or strategy presentations in the market analysis or competitive analysis sections.
-
Recommended For
Marketing professionals, business strategists, and executives presenting market conditions, competitive positioning, and product performance. Commonly used in investor pitch decks, business proposals, quarterly performance reports, and strategic planning meetings.
-
Slide Structure
Slide 1: 5-item × 3-series segmented horizontal bar chart with blue gradient color scheme / Slide 2: 5-row × 4-column data table with navy header row and alternating row background colors. All numerical values and text fields are fully editable.
Related Products
-

Chemical Experiment Analysis Graph Chart – Visualizing R&D Achievements
#Technical Approach #Market and Competitor Analysis #Diagram
-

Red Ratio Horizontal Bar Graph – Market Analysis and Trends
#Market and Competitor Analysis #Diagram #Graph
-

Industry-leading Key Performance Analysis Charts
#Company Introduction #Market and Competitor Analysis #Diagram
-

Graph Charts for Systematic Market Analysis – Bar and Pie Charts
#Technical Approach #Market and Competitor Analysis #Diagram
