Smart Healthcare Donut Chart – Market and Competition Analysis
RJ0600017_22
- Last Update 06/25/2025
- File Size 0.2MB
- # of Slides 2
- File Format PPTX
- Slide Ratio 16:9
- Color
Keywords
- #Content-Based Slides
- #Design-Based Slides
- #Business Strategy
- #Market and Competitor Analysis
- #Graph
- #Achievements
- #Competitive Advantage
- #Circles
- #Doughnut Chart
- #16:9
- #donut chart PowerPoint
- #donut graph template
- #data ratio visualization slide
- #market analysis chart
- #competitive analysis PPT
- #pie chart alternative
- #data comparison slide
About the Product
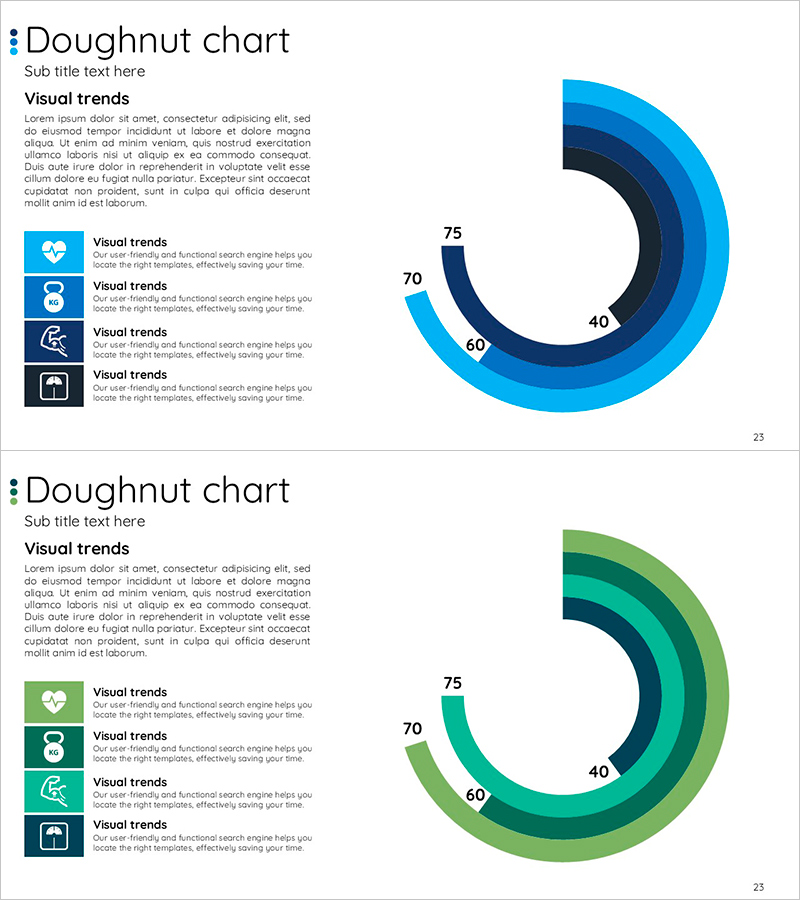
A professional donut chart PowerPoint slide designed for market analysis and competitive positioning strategies. This 2-slide set features multi-layered donut structures in blue and green gradients, visualizing four data points (40, 60, 70, 75) with clear proportional representation. Each slide combines a left text area with descriptive content and a right-aligned donut chart, supplemented by four icon-based information items for enhanced communication. Delivered in 16:9 widescreen PPTX format, fully editable and ready for immediate use in business presentations, investor pitches, and strategic planning sessions.
Usage Points
-
Main Usage
Effectively compare multiple data series and illustrate part-to-whole relationships with visual clarity. Ideal for presenting market share, competitor benchmarking, business unit revenue composition, customer segment distribution, and other quantitative metrics in a compelling format.
-
How to Use
Edit the left text area with analysis context, objectives, and conclusions. Customize the donut chart values and colors to match your actual data. Use the four icon items to highlight key insights or action points. Adjust slide sequence as needed to align with your presentation narrative.
-
Recommended For
Strategy and business planning professionals, marketing and sales leaders, executives preparing board reports and investor presentations. Particularly effective for market analysis, competitive positioning, business portfolio explanation, and customer insights sharing.
-
Slide Structure
2-slide layout. Each slide features a title area, left text block (body copy + 4 icon-based items), and right-aligned donut chart with 4 data points in multi-ring structure. Unified blue-green gradient color scheme optimized for 16:9 widescreen format.
Related Products
-

Progress Donut Chart for Each Library Service
#Business Strategy #Market and Competitor Analysis #Graph
-

Construction Facilities Status Donut Chart – Visualizing Business Strategies
#Business Strategy #Market and Competitor Analysis #Graph
-

Yoga's Advantage Donut Chart – Path to Wellness
#Business Strategy #Market and Competitor Analysis #Graph
-

Visualizing Business Performance with Tube Donut Chart – Strategies for Competitive Advantage
#Business Strategy #Market and Competitor Analysis #Graph
