Chart Analysis of Aerobic Exercise – Market Share Visualization
RJ0600017_17
- Last Update 06/25/2025
- File Size 1.6MB
- # of Slides 2
- File Format PPTX
- Slide Ratio 16:9
- Color
Keywords
- #Content-Based Slides
- #Design-Based Slides
- #Market and Competitor Analysis
- #Diagram
- #Graph
- #Market Share
- #Market Overview
- #Table
- #Circles
- #Standard Table
- #Pie Chart
- #16:9
- #pie chart PowerPoint slide
- #pie graph presentation template
- #market share visualization
- #data visualization slides
- #business analysis PowerPoint
About the Product
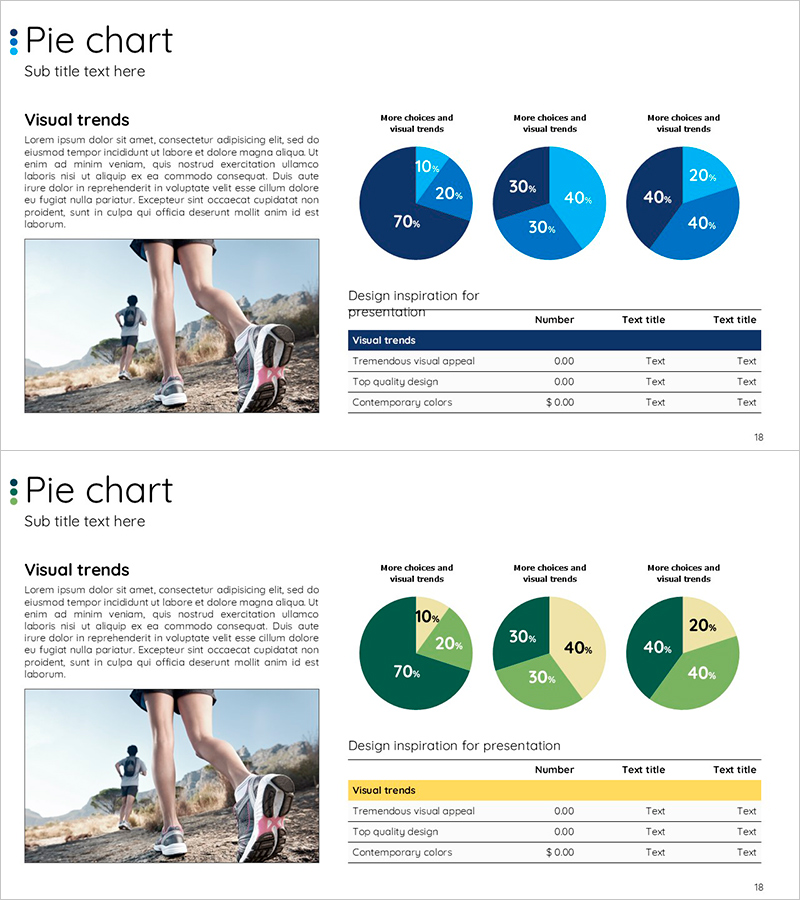
A professional pie chart PowerPoint slide for aerobic exercise market analysis. Features two color schemes (dark blue and light blue / dark green and light green) with 3-segment pie charts that clearly represent market share, consumer choice trends, and visual insights. Each slide combines a full-width image area on the left with charts and data tables on the right, making it ideal for business presentations, market analysis reports, and strategic planning decks. Fully editable PPTX format allows you to customize percentages, labels, and colors to match your data and brand guidelines.
Usage Points
-
Main Usage
Visualize quantitative data such as market share percentages, consumer choice distribution, and compositional ratios using clear pie chart segments. Input actual percentages and metrics to communicate data-driven insights to executives, investors, and marketing teams.
-
How to Use
Insert relevant images (sports, products, market scenes) in the left image area. Enter your actual data percentages in the pie chart segments on the right. Enhance the analysis by adding interpretation details in the table section below the charts. Customize colors and labels to align with your corporate branding.
-
Recommended For
Marketing team market analysis reports, quarterly business performance presentations to executives, investor pitch decks and fundraising materials, business consulting proposals, academic presentations, and data-driven decision-making meetings.
-
Slide Structure
2-slide deck. Each slide features a full-width image area on the left (for photos and visuals) and a 3-segment pie chart on the right with percentage labels, plus a data table below showing metrics, values, and descriptions. 16:9 widescreen format, fully editable PPTX.
Related Products
-

Market Analysis Report Visualized with Pie Chart
#Market and Competitor Analysis #Diagram #Graph
-

Square Frame Presentation Template – Pie Chart & Table
#Market and Competitor Analysis #Financial Plans and Performance #Diagram
-

Red-Blue Stereoscopic Pie Charts – Performance Visualization
#Company Introduction #Market and Competitor Analysis #Diagram
-

ABSTRACT PATTERN Presentation PIE CHART – Clearly Visualize Market Share
#Market and Competitor Analysis #Financial Plans and Performance #Diagram
