Column Chart for Comparative Analysis – Market and Competitive Advantage
RJ0600017_29
- Last Update 06/25/2025
- File Size 0.3MB
- # of Slides 2
- File Format PPTX
- Slide Ratio 16:9
- Color
Keywords
About the Product
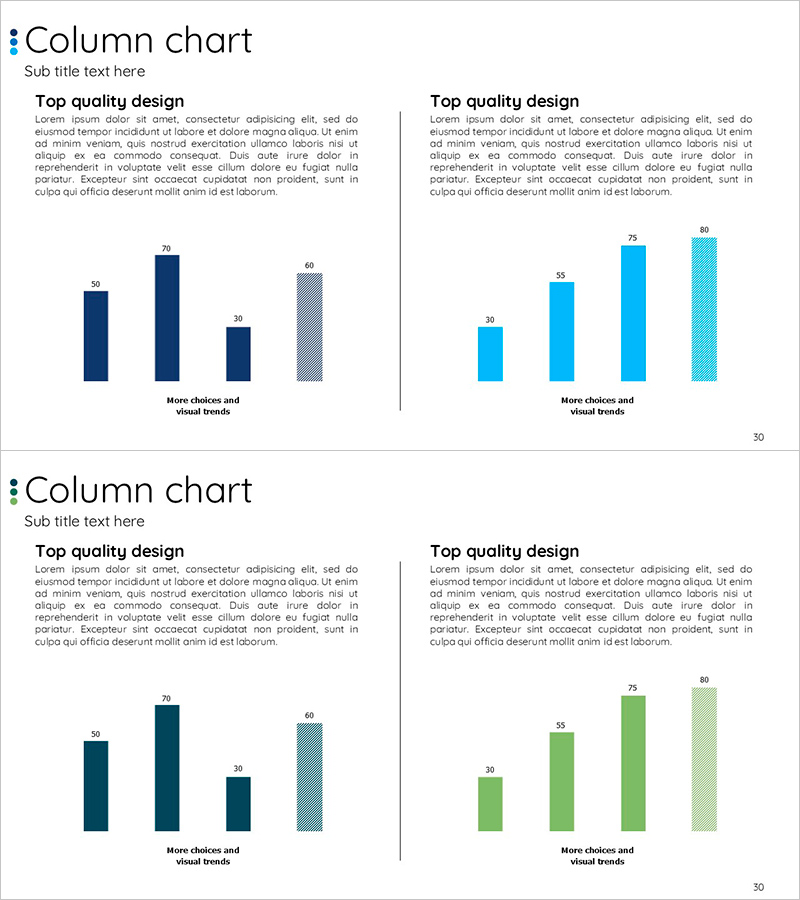
A vertical column chart PowerPoint slide optimized for market analysis and competitive advantage comparison. This presentation template features four data series represented in dark blue, light blue, and pattern fills, arranged in a symmetrical left-right layout with clear numerical labels above each column. The 2-slide set uses identical layouts with varying color combinations to add visual diversity to your presentation. With ample text areas, this slide deck is ready to use for quantitative data-driven presentations including market overview, competitor benchmarking, performance analysis, and strategic reporting.
Usage Points
-
Main Usage
Visualize quantitative data comparisons such as market size, competitor performance, departmental results, and year-over-year trends through intuitive column heights. The symmetrical left-right layout enables simultaneous comparison of two data perspectives, delivering compelling visual evidence for executive presentations, investor pitches, and strategic planning meetings.
-
How to Use
Replace each column value with your own data and enter category names and descriptions in the text areas. Colors can be adjusted to match your corporate brand guidelines. Duplicate the 2-slide template to represent additional data sets. Use PowerPoint's native shape editing tools to freely adjust the number of columns and data series as needed.
-
Recommended For
Ideal for executives, finance teams, marketing departments, and sales teams presenting quarterly or annual performance reports, market research findings, competitor benchmarking analysis, and investor updates. Particularly effective in B2B proposals, business plans, and management reports where data-driven credibility is essential.
-
Slide Structure
Both slides feature identical layouts with a title area, left-side 4-column set (dark blue, light blue, dark blue, pattern fill), and right-side 4-column set (light blue, light blue, light blue, pattern fill). Numerical labels appear above each column, with category label areas below for easy text input and customization.
Related Products
-

Market Analysis Vertical Bar Graph – Visualizing Data
#Market and Competitor Analysis #Graph #Market Analysis
-

Comparative Analysis of Eco-Friendly Categories Slide – Market Competitive Advantage
#Market and Competitor Analysis #Financial Plans and Performance #Diagram
-

Modern Business Plan Template – Clustered Column Graph
#Market and Competitor Analysis #Graph #Market Analysis
-

Comparative Vertical Graphs by Region – Effective Market Analysis
#Market and Competitor Analysis #Graph #Market Analysis
