Human Analysis Chart – Visualizing Customer Analysis and Market Share
RJ0600017_11
- Last Update 06/25/2025
- File Size 0.2MB
- # of Slides 2
- File Format PPTX
- Slide Ratio 16:9
- Color
Keywords
- #Content-Based Slides
- #Design-Based Slides
- #Market and Competitor Analysis
- #Graph
- #Other
- #Customer Analysis
- #Market Share
- #Circles
- #Pie Chart
- #16:9
- #pie chart PowerPoint slide
- #human analysis template
- #customer segmentation chart
- #market share visualization
- #circular graph template
- #data comparison slide download
About the Product
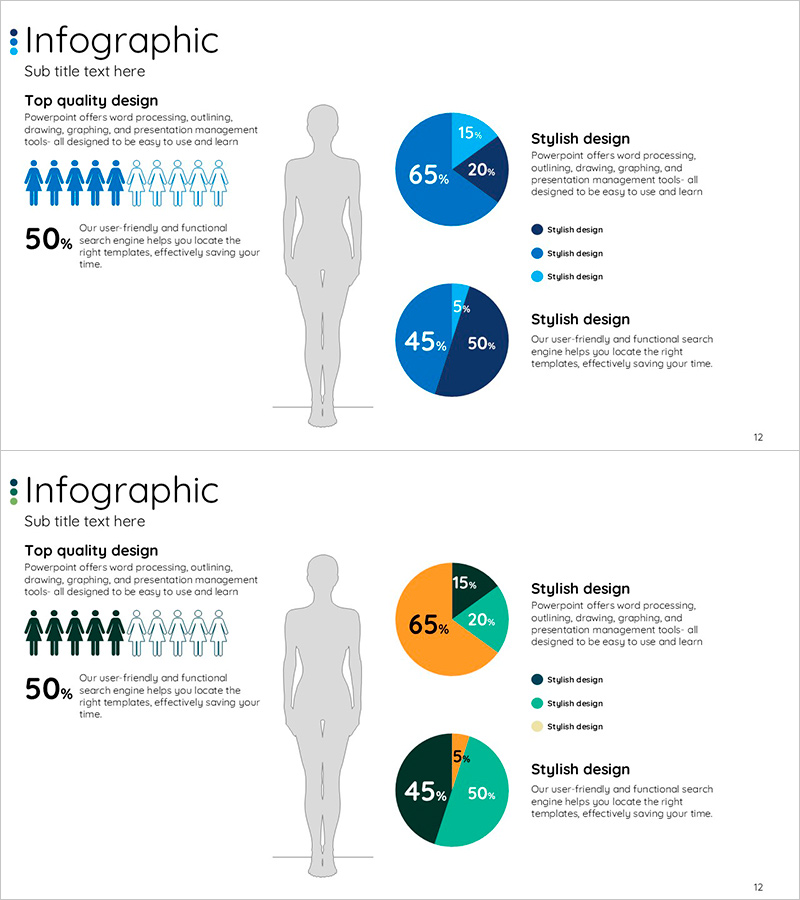
A PowerPoint slide template that visualizes customer analysis and market share using human silhouette graphics combined with pie charts. Available in two color schemes—blue and orange—each slide features a human figure illustration paired with two circular charts for intuitive data comparison. Includes text boxes and legends, making it ready for immediate use in presentations, marketing plans, and market analysis reports. Provided in 16:9 widescreen PPTX format with 2 slides.
Usage Points
-
Main Usage
Communicate ratio-based data such as customer segmentation, market share, and demographic analysis through dual visualization of human figures and pie charts, enhancing audience comprehension. Ideal for marketing strategy, market research findings, and customer analysis sections in business presentations.
-
How to Use
Display customer composition using icons on the human silhouette on the left, then input percentage data into the pie charts on the right. Add legends and text descriptions to clarify each segment's meaning. Use the blue version for corporate reports and the orange version for creative presentations.
-
Recommended For
Marketing professionals, market analysts, business executives, management consultants, and academic presenters. Recommended for any presentation requiring customer analysis, market segmentation, demographic analysis, or sales performance reporting.
-
Slide Structure
2-slide layout. Each slide features a left-aligned human silhouette (gray tone), center text area, and right-aligned dual pie charts (3–4 segments each). Title at top, legend at bottom. Color-coded versions: blue scheme (navy, light blue, black) and orange scheme (orange, teal, black).
Related Products
-

Drug Addiction Gender Ratio Analysis Graph - Customer Analysis
#Market and Competitor Analysis #Graph #Other
-

Camera Pie Chart – Market Share Analysis
#Market and Competitor Analysis #Graph #Other
-

User Analysis on Coffee and Smoking – Market Trends and Insights
#Market and Competitor Analysis #Graph #Other
-

European Target Market Share Graph – The Power of Market Analysis
#Market and Competitor Analysis #Graph #Other
