
Drug Addiction Presentation Template – Effective Delivery with Striking Visuals
J0400047
- Last Update 01/08/2025
- File Size 14.6MB
- # of Slides 35
- File Format PPTX
- Slide Ratio 16:9
- Color
Slide Preview


Keywords
About the Product
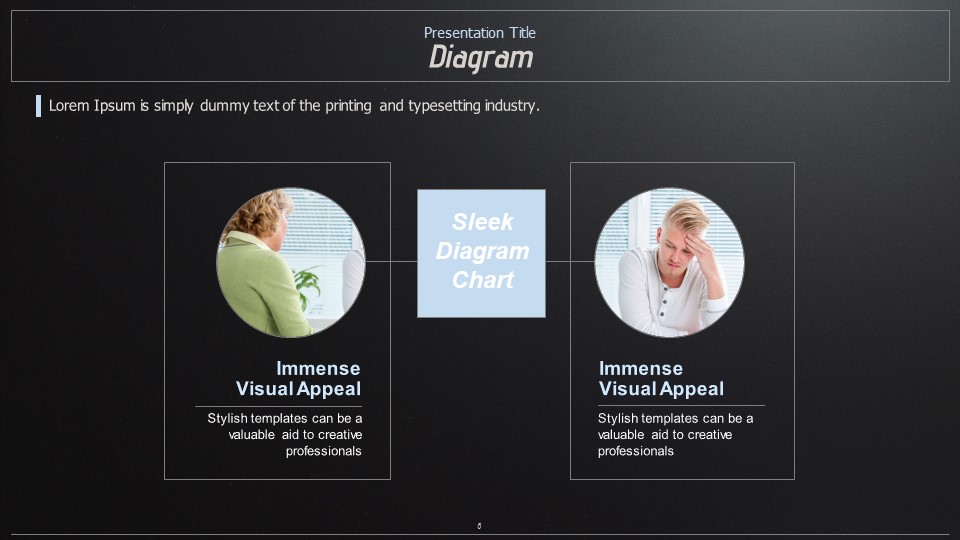
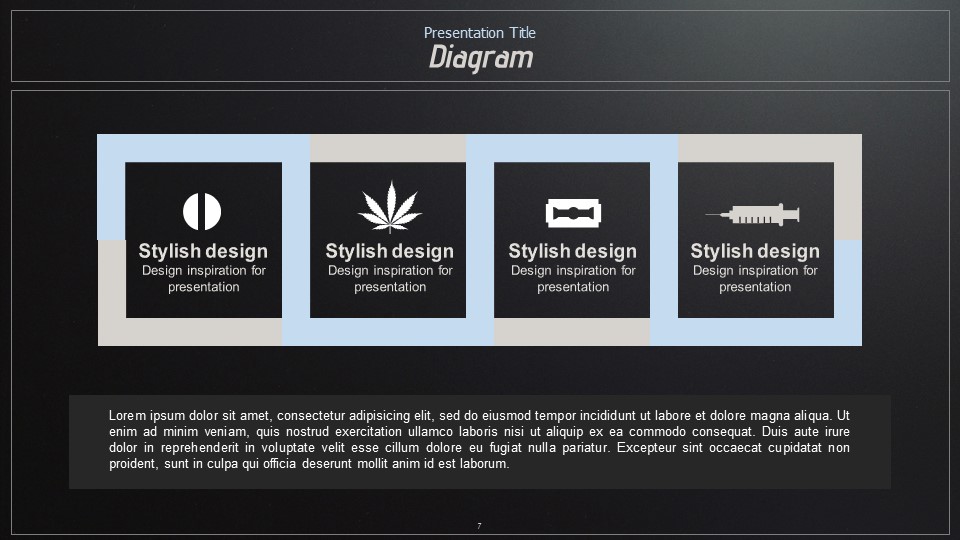
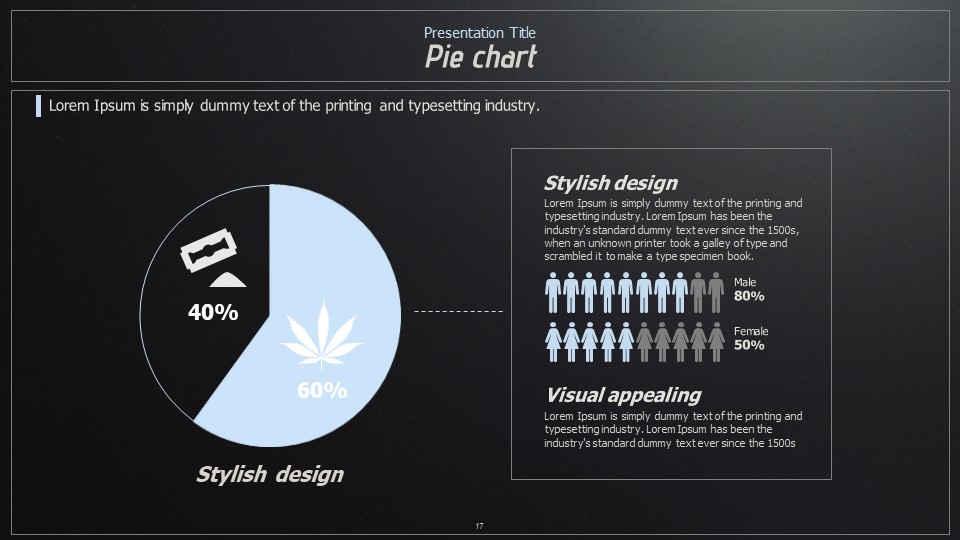
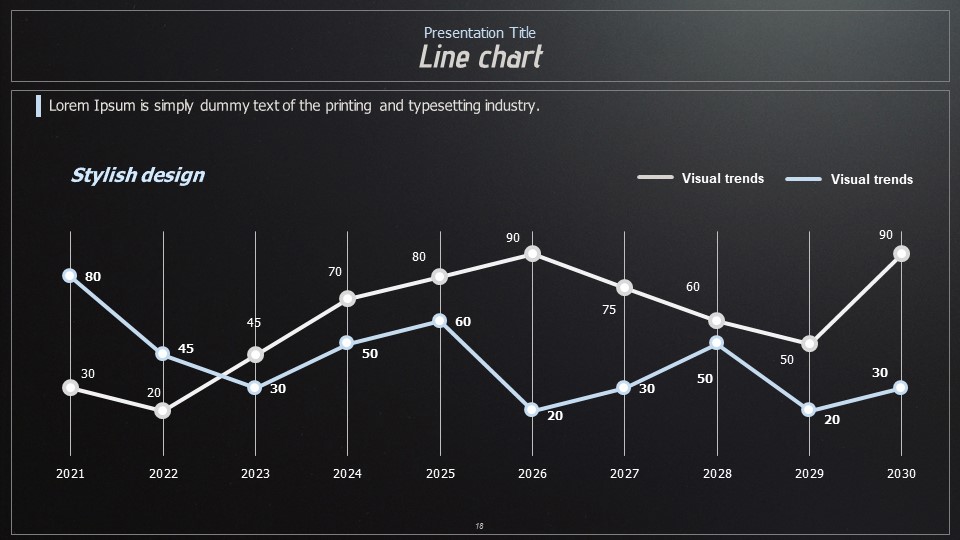
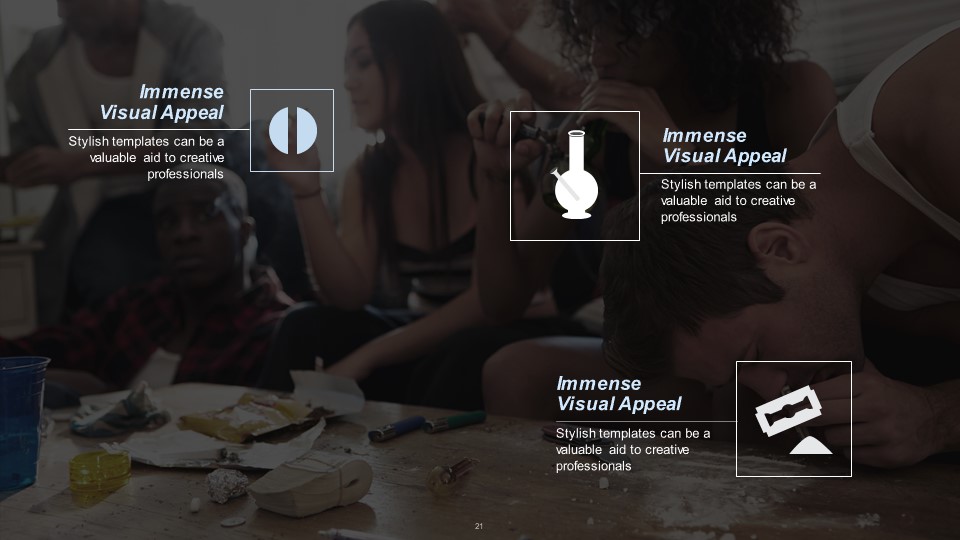
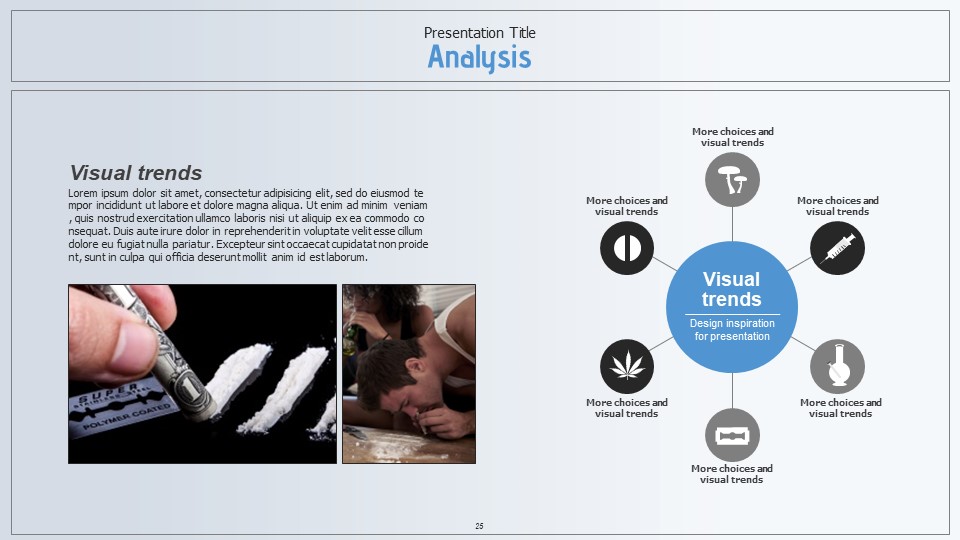
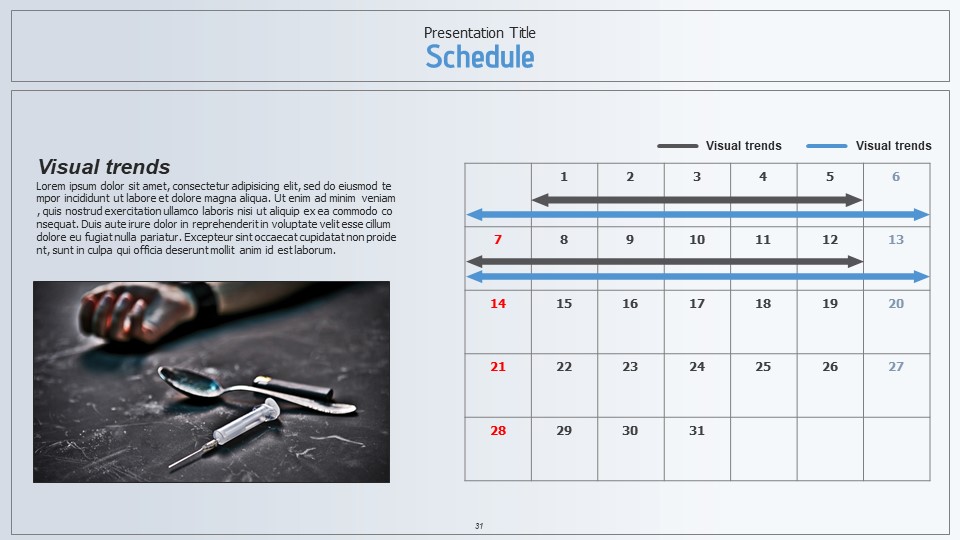
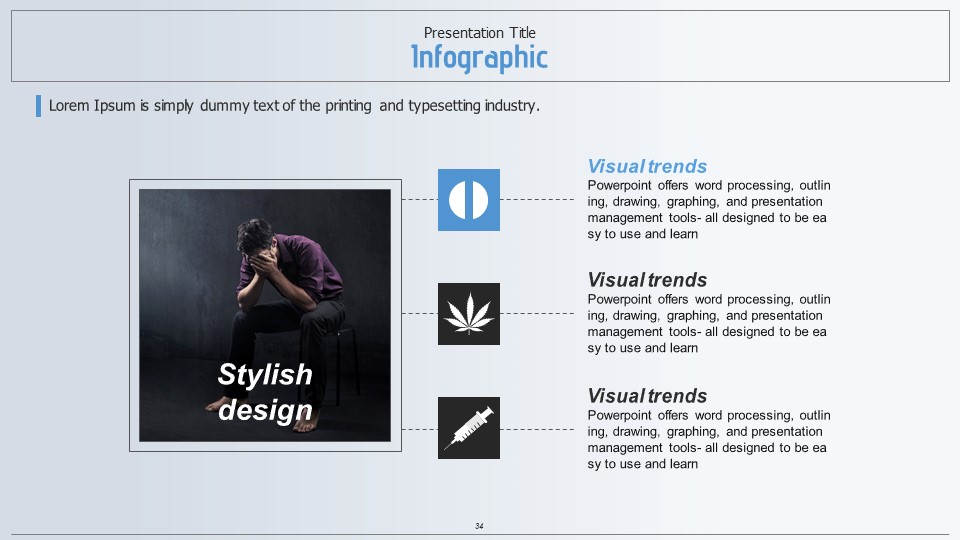
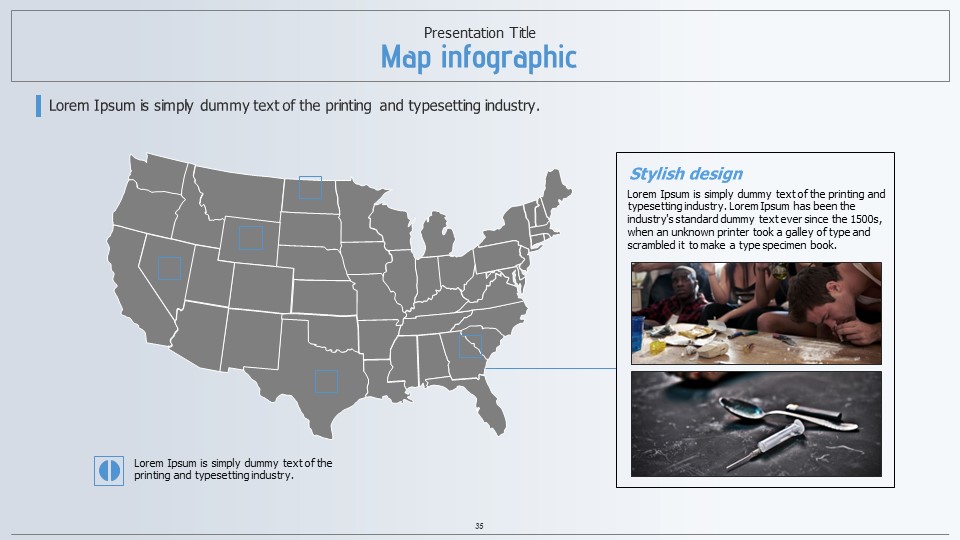
A professional PowerPoint template designed for medical and public health presentations on drug addiction and substance abuse. Built on a dark charcoal and black background with white and light blue typography, the deck visually conveys the gravity of the subject matter. The cover slide features a full-screen photographic image for immediate visual impact, while body slides include circular flow diagrams, dual doughnut charts, two-column horizontal bar charts, and image gallery layouts — providing a comprehensive set of data visualization tools. With 35 fully editable PPTX slides, this presentation covers drug abuse statistics, addiction mechanisms, prevention strategies, and policy proposals in a single cohesive deck. All text, chart data, and color elements can be customized freely to suit your specific presentation needs.
Usage Points
-
Main Usage
Ideal for presenting drug addiction statistics, substance abuse mechanisms, and prevention or treatment policy proposals in medical, academic, and public health settings. The dark tone reinforces the seriousness of the topic.
-
How to Use
Replace the cover photo and title with your presentation topic, update the doughnut and bar chart data with real statistics, and edit diagram text and image gallery slides to match your content. All elements are fully editable in PowerPoint.
-
Recommended For
Recommended for public health officials, medical school professors and researchers, drug prevention educators, social workers, and healthcare policy professionals preparing formal presentations or academic lectures.
-
Slide Structure
Includes a full-screen photo cover, two circular flow diagram slides, two doughnut chart slides, a two-column horizontal bar chart comparison slide, and an image gallery with diagram layout — 35 slides total in 16:9 PPTX format.
Related Products
-

Science Experiment Presentation Template – Creative Visual and Design
#Science/Medical
-

Virus PowerPoint Template – Modern and Professional Design
#Science/Medical
-

Oriental Medicine Presentation Wide – Modern and Stylish Design
#Science/Medical
-

New Drug Introduction Presentation Template – Scientific and Stylish Design
#Science/Medical
