
Plastic Surgery Presentation Template – Professional Visual Representation
J0700005
- Last Update 02/28/2025
- File Size 14.9MB
- # of Slides 31
- File Format PPTX
- Slide Ratio 16:9
- Color
Slide Preview


Keywords
About the Product
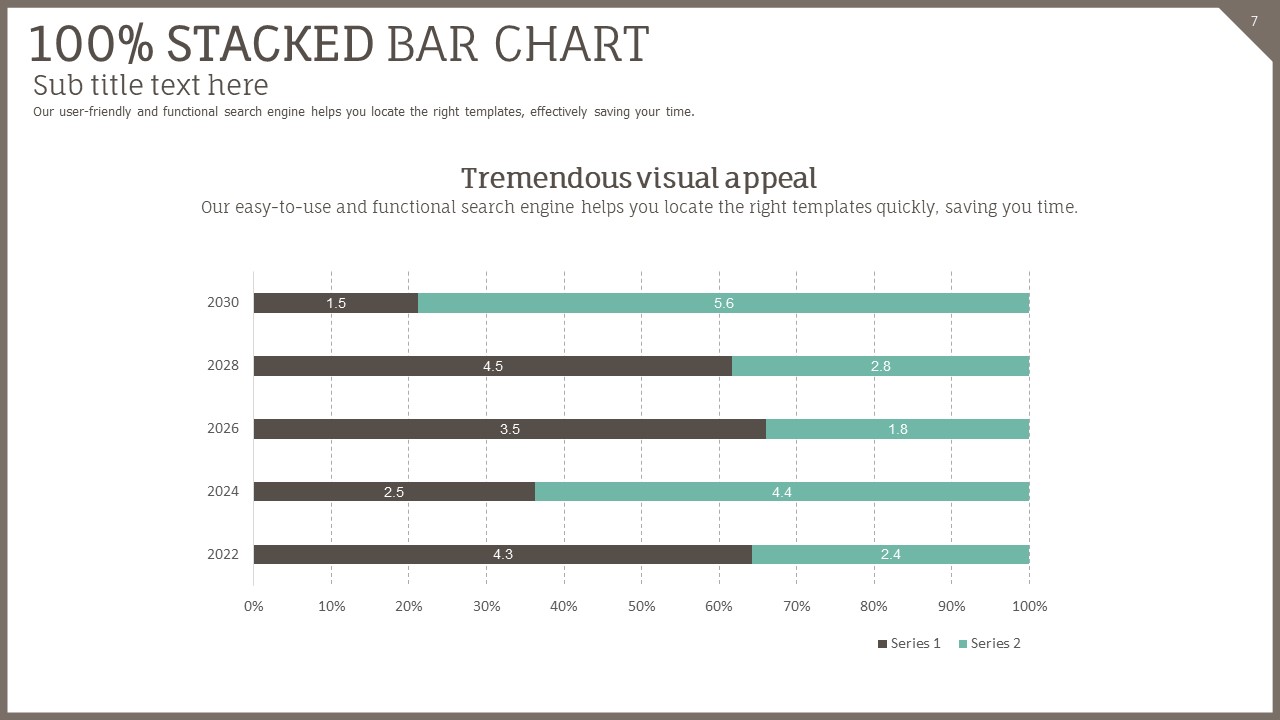
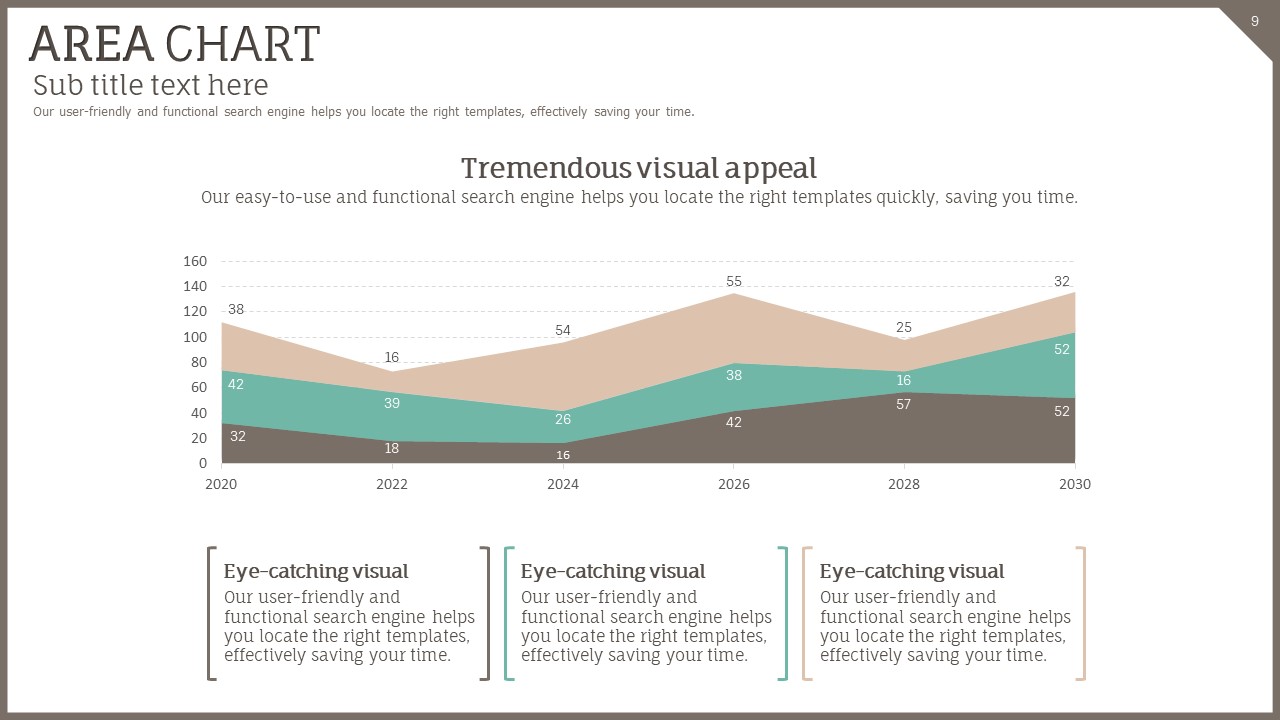
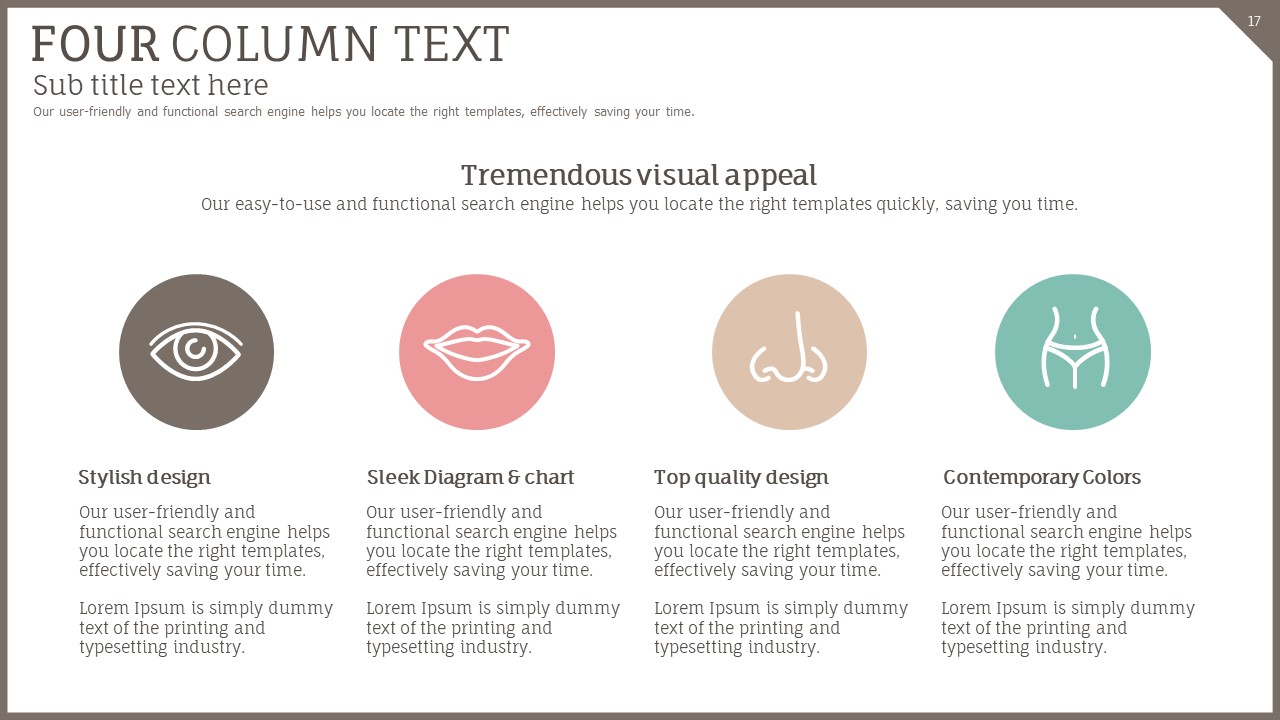
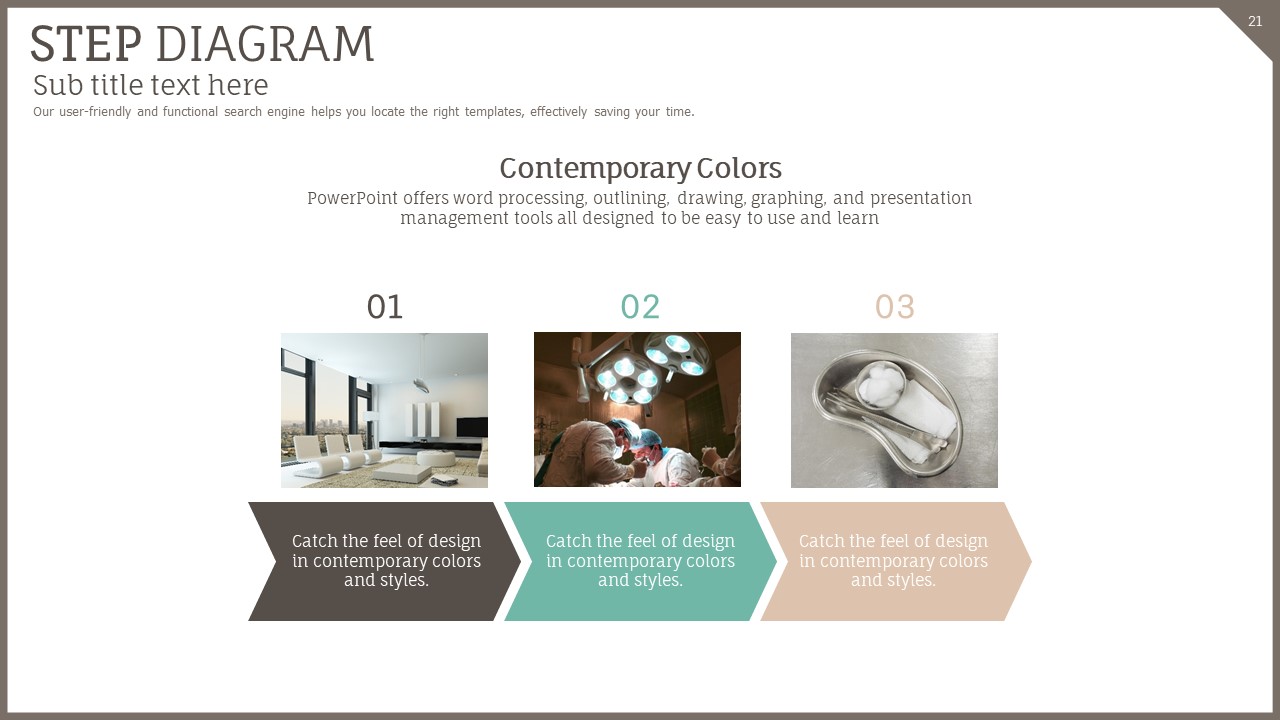
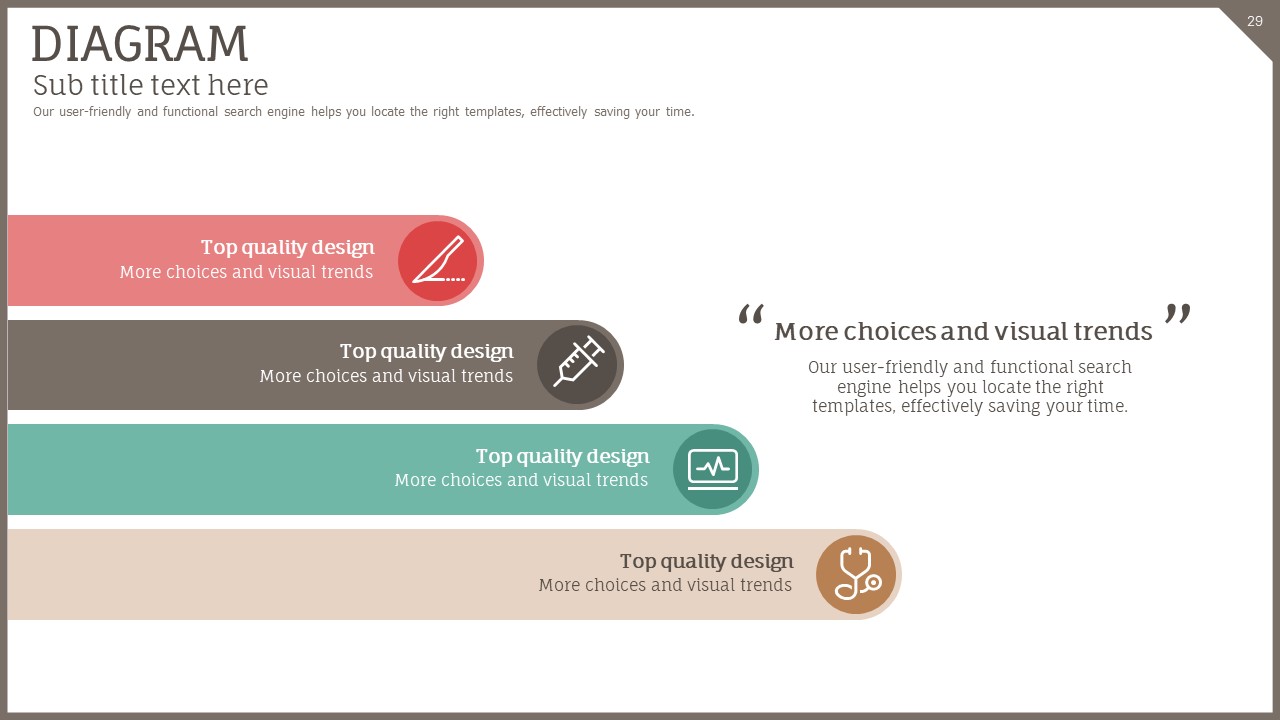
This professional PowerPoint template for plastic surgery and medical clinics features a warm cream-beige background paired with mint green and rose-pink accent colors. The 31-slide deck covers every presentation need for healthcare and aesthetic clinics: a full-bleed cover slide with high-quality portrait photography, a history timeline, step diagrams, a world map slide, circular and Venn diagrams with line-style beauty icons, a picture-and-text four-grid layout, and a team introduction slide with circular profile cutouts. The image-forward layout balances clinical professionalism with a soft, approachable aesthetic, making it ideal for procedure introductions, clinic branding decks, and investor presentations. Fully editable in PPTX format—swap text, colors, and photos to match your clinic's brand identity in minutes.
Usage Points
-
Main Usage
Designed for plastic surgery clinics, dermatology practices, and aesthetic medical centers to present procedures, clinic branding, medical team profiles, and hospital history in a polished, professional PowerPoint format.
-
How to Use
Download the PPTX file and open it directly in PowerPoint. Replace placeholder text, images, and colors with your clinic's content. Select only the slides you need and rearrange them to build a tailored presentation or report in minutes.
-
Recommended For
Plastic surgeons, dermatologists, clinic marketing managers, medical device sales representatives, hospital PR teams, and researchers presenting at aesthetic medicine conferences who need a professional, visually consistent slide deck.
-
Slide Structure
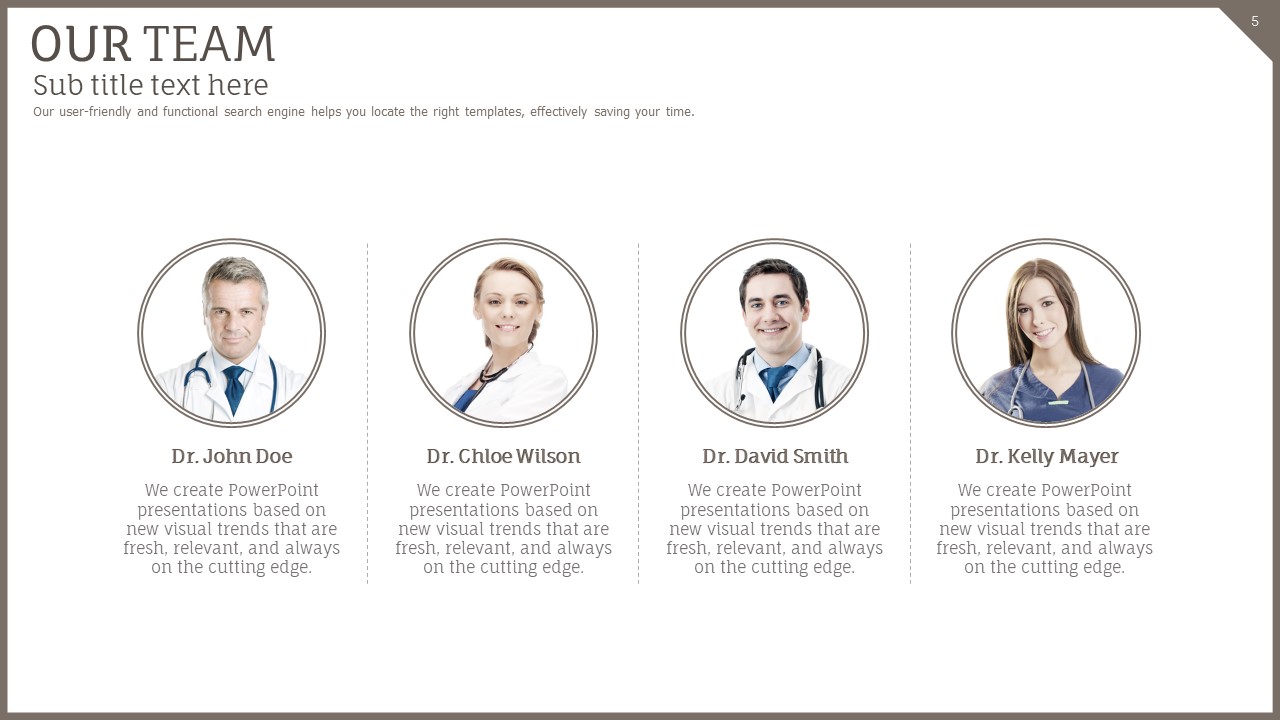
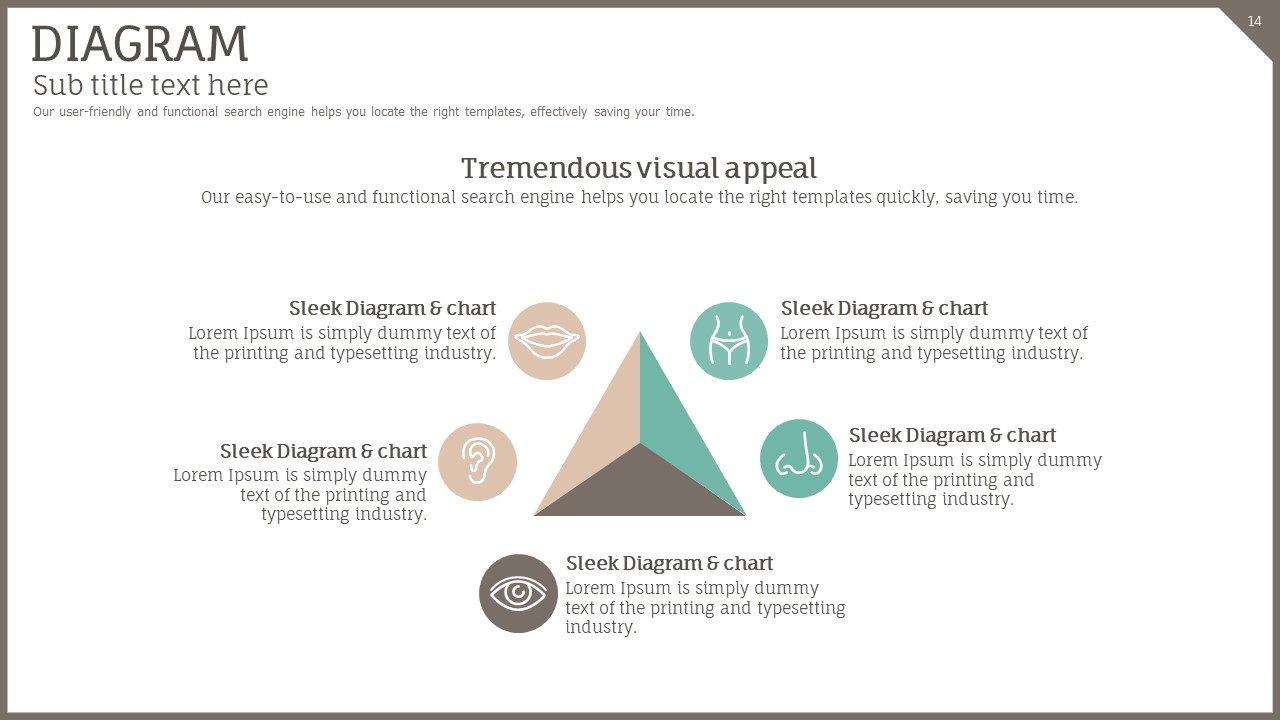
31 slides including: full-bleed cover with portrait photo, history timeline (2024–2030), step diagram with photo panels, world map with data callouts, circular diagram, Venn diagram with beauty-area icons, 4-grid picture-and-text layout, and 4-person team introduction with circular profile photos.
Related Products
-

Medical Presentation Template for Surgery – Professional and Sleek Design
#Science/Medical
-

Virus PowerPoint Template – Modern and Professional Design
#Science/Medical
-

Science Experiment Presentation Template – Creative Visual and Design
#Science/Medical
-

Rocket Presentation Wide Template – Sleek and Intuitive Design
#Science/Medical
