Blue Green Subdivided Graph – Template for Market and Competitor Analysis
RJ0400047_28
- Last Update 05/30/2025
- File Size 0.9MB
- # of Slides 2
- File Format PPTX
- Slide Ratio 16:9
- Color
Keywords
- #Content-Based Slides
- #Design-Based Slides
- #Market and Competitor Analysis
- #Graph
- #Competitor Analysis
- #Market Analysis
- #Horizontal Bar
- #Segmented Horizontal Bar
- #16:9
- #stacked column chart PowerPoint
- #100% stacked bar graph
- #market analysis slide template
- #competitor analysis presentation
- #data visualization PowerPoint
- #ratio comparison chart download
About the Product
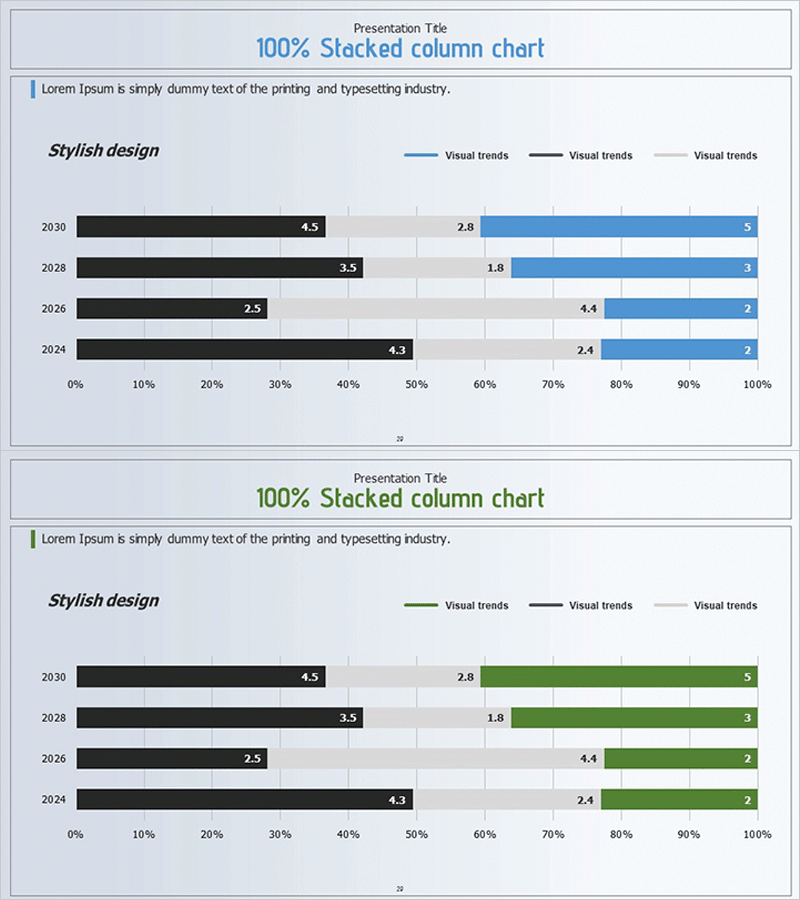
A 100% stacked column chart PowerPoint slide designed for market and competitor analysis presentations. This 2-slide template features blue and green color schemes, displaying 4 years of data (2024–2030) across 3 data series in a horizontal stacked bar format. Each segment includes numeric labels for precise data representation, making it ideal for ratio analysis, market share comparison, and competitive positioning. The slide deck is fully editable and ready to integrate into business strategy, sales performance, and market analysis presentations.
Usage Points
-
Main Usage
Visualize proportional changes over time, such as market share evolution, sales composition, or competitive positioning. The 100% stacked structure clearly shows each series' contribution to the whole, making trend analysis and period-over-period comparison intuitive and impactful.
-
How to Use
Insert into market analysis, business strategy, or quarterly performance review presentations. Replace sample data with your own figures and adjust colors to match your brand guidelines. Choose between blue or green versions depending on your presentation theme and audience context.
-
Recommended For
Marketing managers, business analysts, financial planners, management consultants, and executives presenting market insights, sales trends, or competitive analysis. Particularly effective for C-suite briefings where proportional data trends need clear visual emphasis.
-
Slide Structure
Two-slide set with identical data structure in blue and green color palettes. Each slide displays 4 years (2024, 2026, 2028, 2030) × 3 data series in 100% stacked horizontal bars. Numeric labels on each segment enable precise data reading and professional presentation delivery.
Related Products
-

Horizontal Bar Graph Broken Down by Year – Optimal for Market and Competitor Analysis
#Market and Competitor Analysis #Graph #Competitor Analysis
-

Market Analysis Graph Ahead of the Future – Innovative Business Insights
#Market and Competitor Analysis #Diagram #Graph
-

Segmented Graph of Learning Goal Achievement – Market and Competitor Analysis
#Market and Competitor Analysis #Graph #Competitor Analysis
-

Financial Management Analysis Detailed Graph
#Market and Competitor Analysis #Graph #Competitor Analysis
