Blue Green Double Bar Graph – Perfect for Market Analysis
RJ0400047_10
- Last Update 05/29/2025
- File Size 1.5MB
- # of Slides 2
- File Format PPTX
- Slide Ratio 16:9
- Color
Keywords
- #Content-Based Slides
- #Design-Based Slides
- #Market and Competitor Analysis
- #Graph
- #Competitor Analysis
- #Horizontal Bar
- #Horizontal Bar Chart
- #16:9
- #horizontal bar chart PowerPoint
- #dual-series bar graph presentation
- #market analysis slide template
- #competitive comparison chart
- #data comparison PowerPoint slide
About the Product
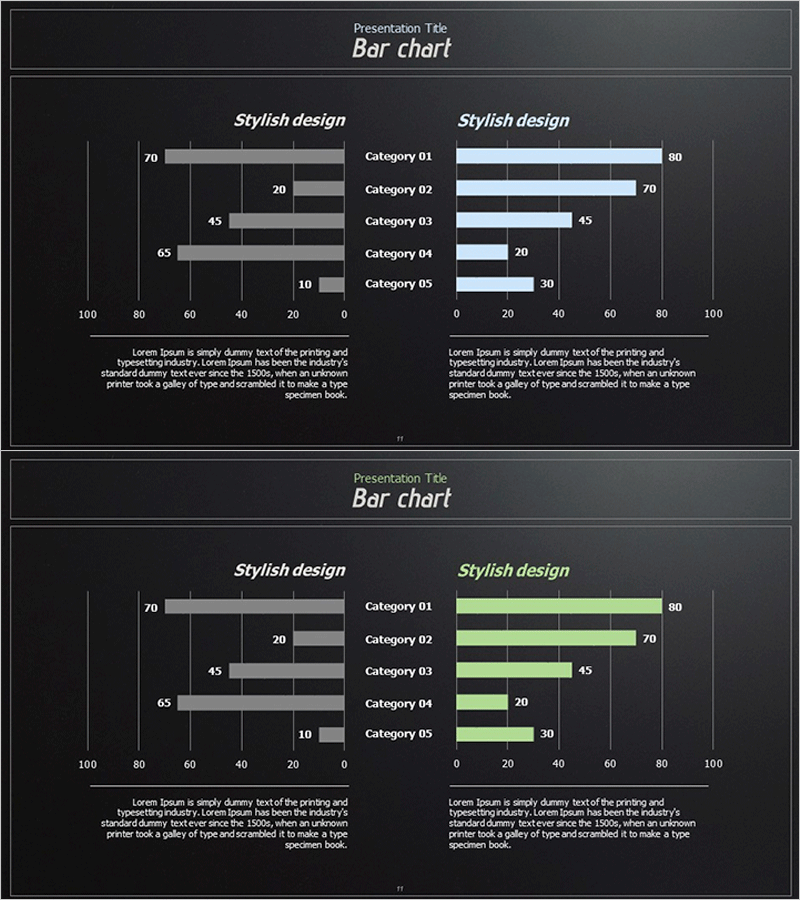
A horizontal bar chart PowerPoint slide optimized for market analysis and competitive comparison. This presentation template displays data for five categories using blue and green color series side by side, enabling intuitive numerical comparison between items. The symmetrical layout with a reverse-direction axis on the left and a standard axis on the right is highly effective for contrastive analysis. Each bar includes numerical labels for accurate data interpretation. Composed of 2 slides in 16:9 widescreen format with dedicated text areas for additional presentation notes. The bright bar colors contrast sharply against the dark background, ensuring clear visibility in projector environments.
Usage Points
-
Main Usage
Ideal for market analysis, competitive benchmarking, sales performance comparison, and departmental performance reviews where two data series need simultaneous visualization and contrast analysis. The side-by-side bar arrangement allows viewers to quickly identify differences and trends across categories.
-
How to Use
Edit the bar lengths and numerical labels with your own data for immediate use. Maintain the reverse-axis left and standard-axis right structure while updating category names and values. Colors are fully customizable, and you can add analysis insights or conclusions in the text area below to complete your presentation narrative.
-
Recommended For
Marketing managers, sales directors, financial analysts, executives preparing performance reports, consulting project teams, and academic presenters who need to visualize numerical comparisons and performance metrics in professional settings.
-
Slide Structure
Two slides featuring five categories (Category 01–05) displayed with a reverse-direction axis (100–0) on the left and a standard axis (0–100) on the right. Blue and green bar pairs represent each category, with numerical labels (10–80) positioned at bar endpoints. A text area at the bottom accommodates additional analysis and interpretation.
Related Products
-

Stylish Bar Chart Slide Design
#Market and Competitor Analysis #Diagram #Graph
-

Data Analysis Bar Graph – Essential for Market and Competitor Analysis
#Market and Competitor Analysis #Graph #Competitor Analysis
-

Mobile SNS Market Analysis Graph – Visualizing Competitor Analysis Data
#Market and Competitor Analysis #Diagram #Graph
-

Eco-friendly Eco Horizontal Bar Graph - Market Competition Analysis
#Market and Competitor Analysis #Graph #Competitor Analysis
