Drug Problem Analysis Donut Circle Graph
RJ0400047_29
- Last Update 05/30/2025
- File Size 0.9MB
- # of Slides 2
- File Format PPTX
- Slide Ratio 16:9
- Color
Keywords
- #Content-Based Slides
- #Design-Based Slides
- #Product/Service Introduction
- #Market and Competitor Analysis
- #Graph
- #Development Status
- #Market Analysis
- #Circles
- #Doughnut Chart
- #16:9
- #donut chart PowerPoint slide
- #donut graph template
- #ratio comparison chart
- #circular data visualization
- #how to create donut chart in PowerPoint
- #data analysis slide template
About the Product
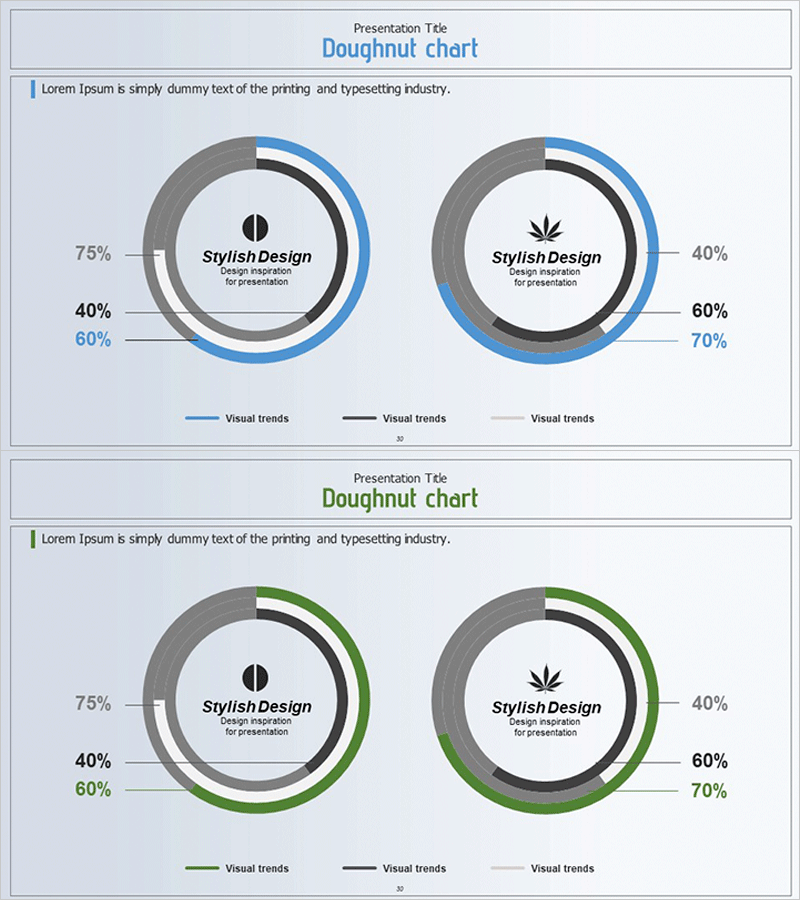
A two-slide donut chart PowerPoint presentation designed for analyzing drug problem statistics and data visualization. Each slide features a central circular area with space for icons or text, surrounded by a donut ring divided into 4 segments for displaying data points and percentages. The first slide uses a blue color scheme (blue, black, gray), while the second employs a green theme (green, black, gray). This presentation template is ready to use for business insights, market analysis, statistical reports, and comparative data presentations.
Usage Points
-
Main Usage
Donut charts effectively display the proportion of parts relative to a whole, making them ideal for comparing 4 categories simultaneously. Use this template for drug problem analysis, market share distribution, customer composition ratios, budget allocation, or any scenario requiring proportional comparison. The central circular area allows for emphasis of key messages or icons.
-
How to Use
Input your data values and percentages into the 4 donut segments on each slide. Add titles or explanatory text in the central circular area. Assign different colors to each data category for visual clarity. The blue theme conveys trust and stability, while the green theme emphasizes growth and positivity. Customize text and numbers to match your presentation content.
-
Recommended For
Ideal for drug problem analysis, social statistics, business insights presentations, market analysis reports, policy proposals, and educational seminars. Suitable for government agencies, research institutions, consulting firms, marketing teams, educational organizations, and any entity presenting data-driven insights.
-
Slide Structure
2-slide template. Each slide contains a central circular area (for icons or text placement) and an outer donut ring divided into 4 segments (each segment displays data values and percentages). Slide 1 features blue color scheme; Slide 2 uses green color scheme. 16:9 aspect ratio, PPTX format.
Related Products
-

Detailed Analysis Circle Graph Presentation Template
#Product/Service Introduction #Market and Competitor Analysis #Graph
-

Pie Chart of Shooting Status Analysis – Visual Insights
#Product/Service Introduction #Market and Competitor Analysis #Diagram
-

Idea Development Status Donut Graph – Effective Market Analysis
#Product/Service Introduction #Market and Competitor Analysis #Graph
-

Development Analysis Donut Graph – Visual Data Presentation
#Product/Service Introduction #Market and Competitor Analysis #Graph
