New Drug Introduction Presentation Template – Scientific and Stylish Design
J0700004
- Last Update 01/02/2025
- File Size 22.6MB
- # of Slides 31
- File Format PPTX
- Slide Ratio 16:9
- Color
Slide Preview


Keywords
About the Product
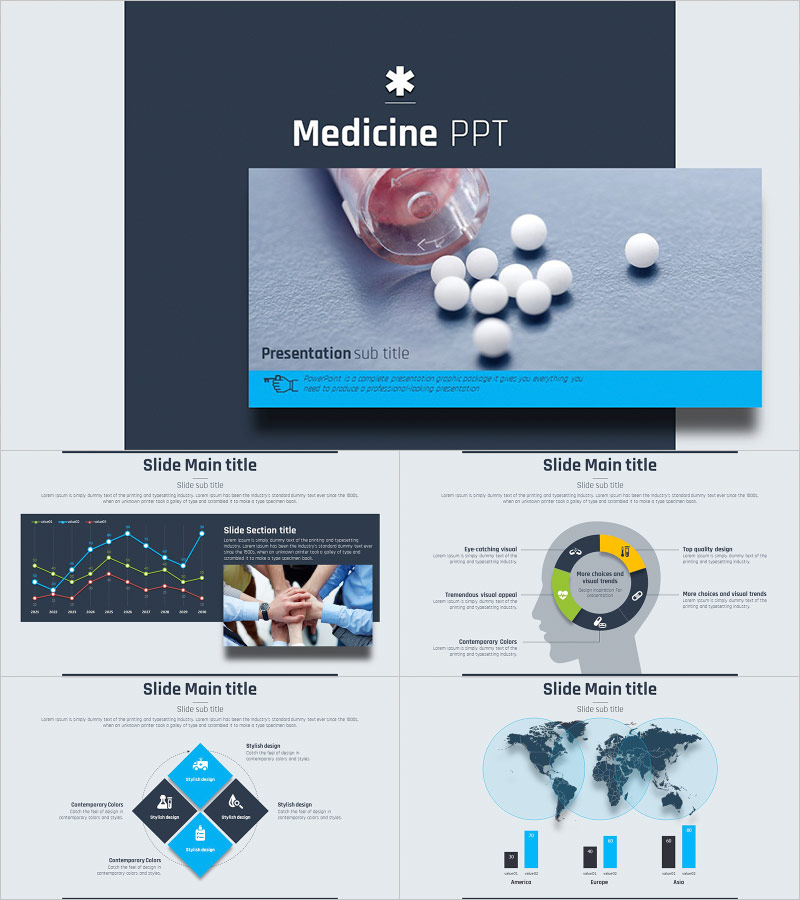
A professional PowerPoint template designed for pharmaceutical and medical presentations, featuring a dark navy background paired with sky-blue accent colors. The cover slide uses a high-quality pill photo to convey clinical credibility and a clean, trustworthy impression. With 31 fully editable slides, this template covers everything from new drug introductions and clinical trial data to global market overviews. Data visualization elements include bar charts, line graphs, a world map infographic, and a three-step circular diagram, making it easy to present complex medical information with clarity. Delivered in 16:9 PPTX format, all text, colors, and images are freely editable, making this presentation deck immediately usable for pharma IR pitches, academic conferences, hospital seminars, and healthcare startup fundraising.
Usage Points
-
Main Usage
Designed for new drug introductions, clinical trial result reports, and pharmaceutical pipeline presentations. The data-rich slide layout helps medical and pharma professionals deliver complex information with authority and visual clarity in front of investors, partners, or academic audiences.
-
How to Use
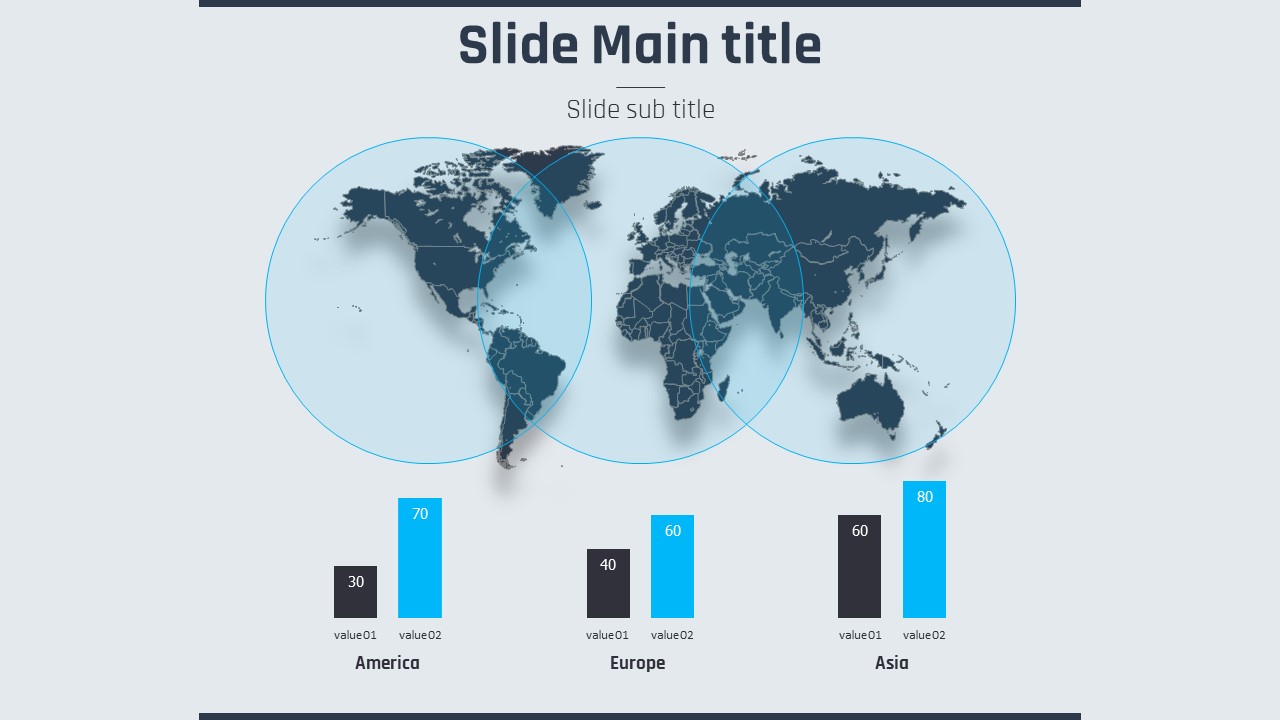
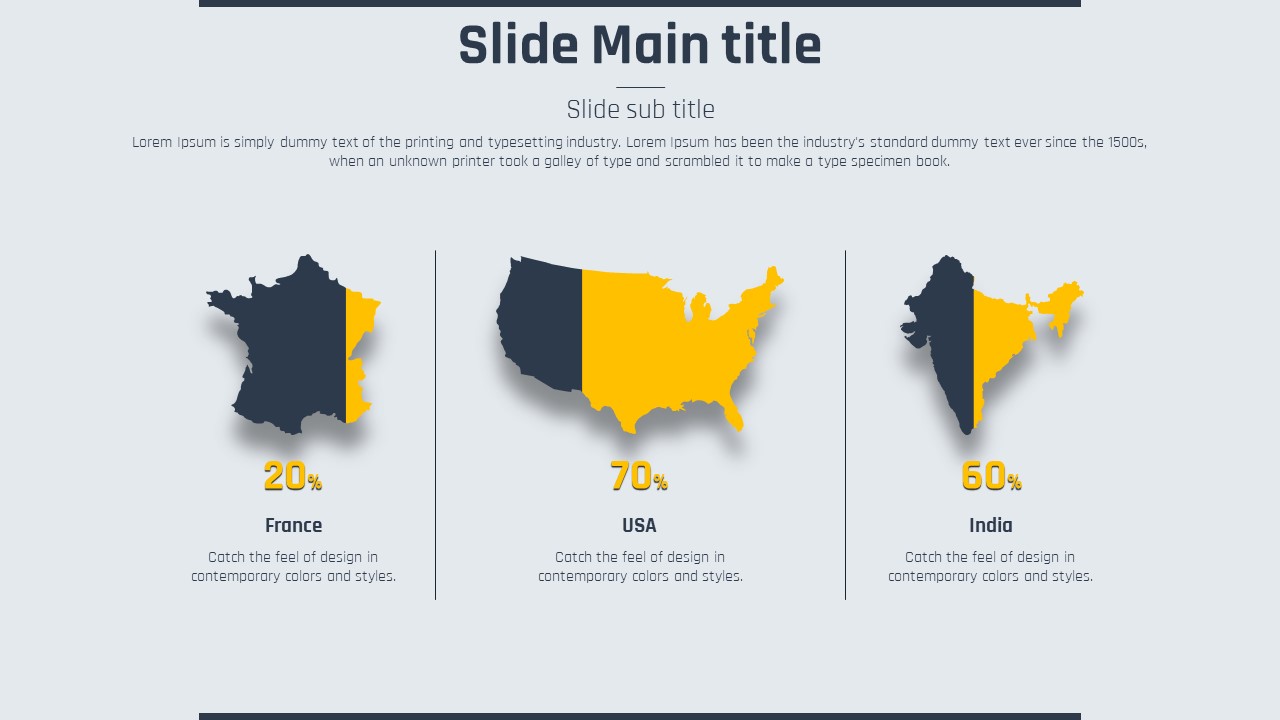
Download the PPTX file, replace the cover pill image and title with your product name, and update the bar chart and line graph values with your actual clinical data. The world map slide can be immediately repurposed to show global market distribution or clinical trial site locations across regions.
-
Recommended For
Recommended for pharmaceutical marketing and IR teams, medical researchers, hospital and medical device company presenters, and healthcare startup founders. Ideal for investor-facing new drug IR pitches, academic symposiums, and hospital seminar presentations.
-
Slide Structure
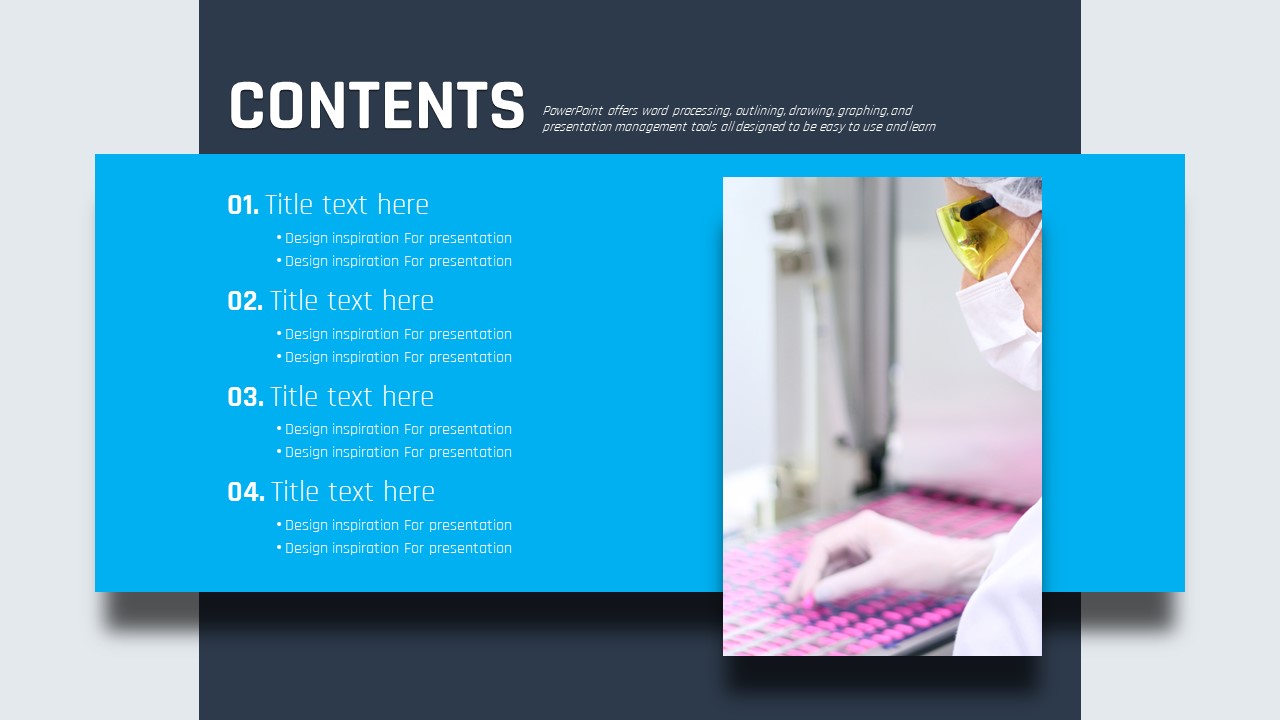
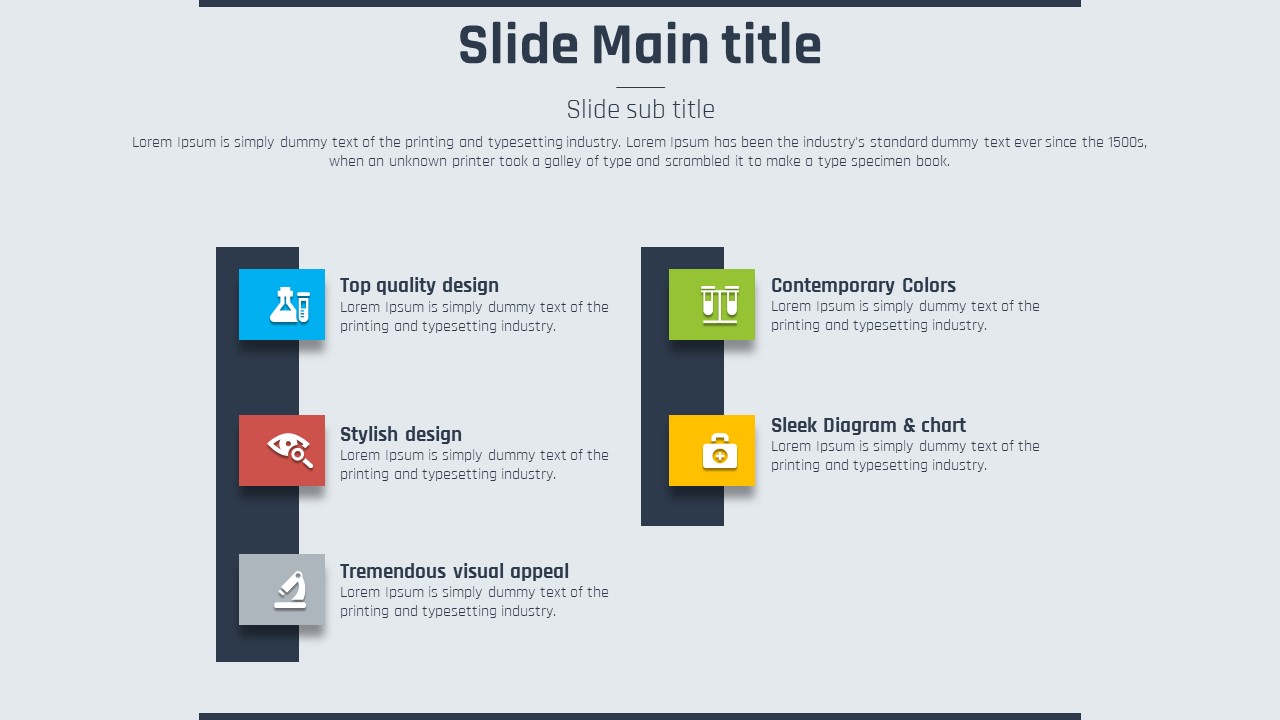
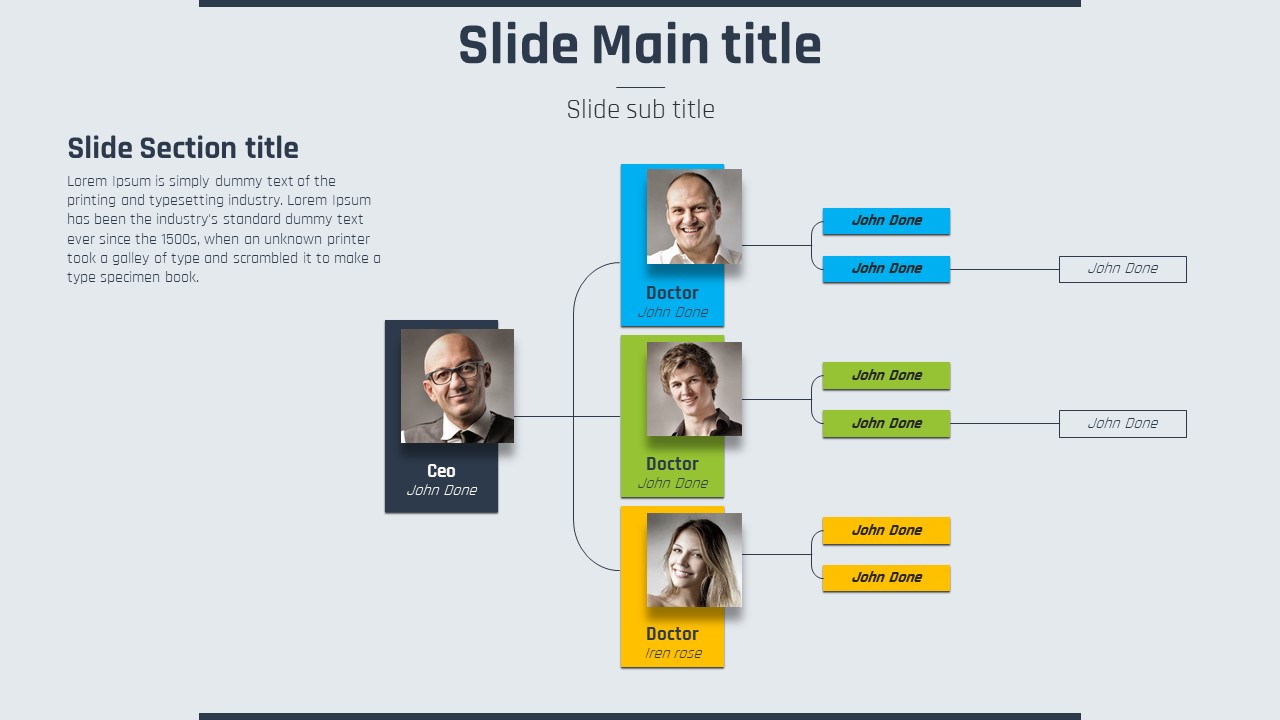
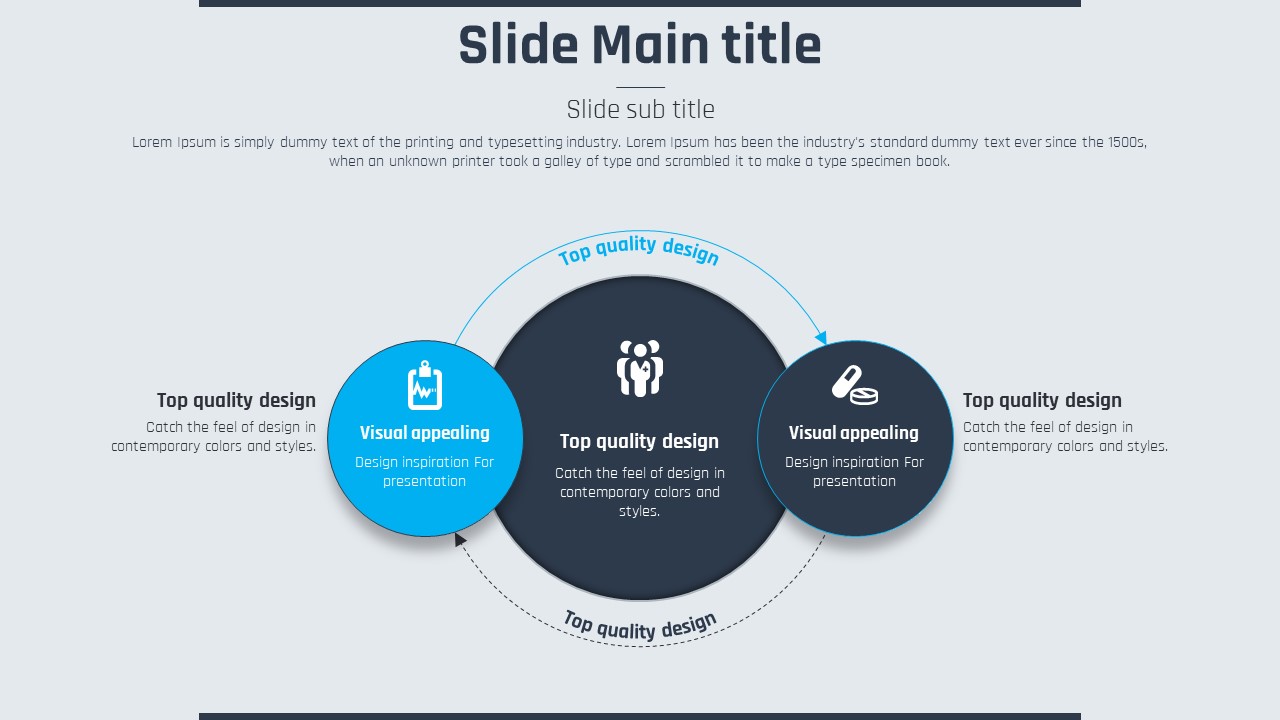
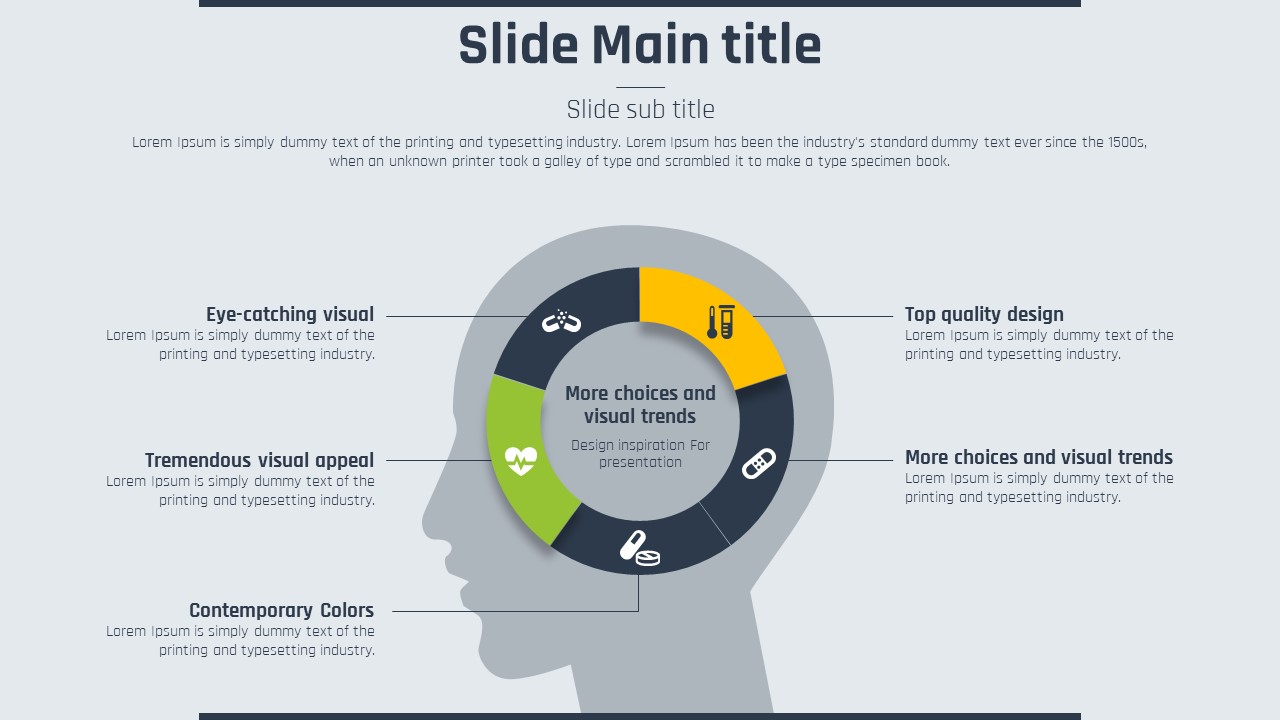
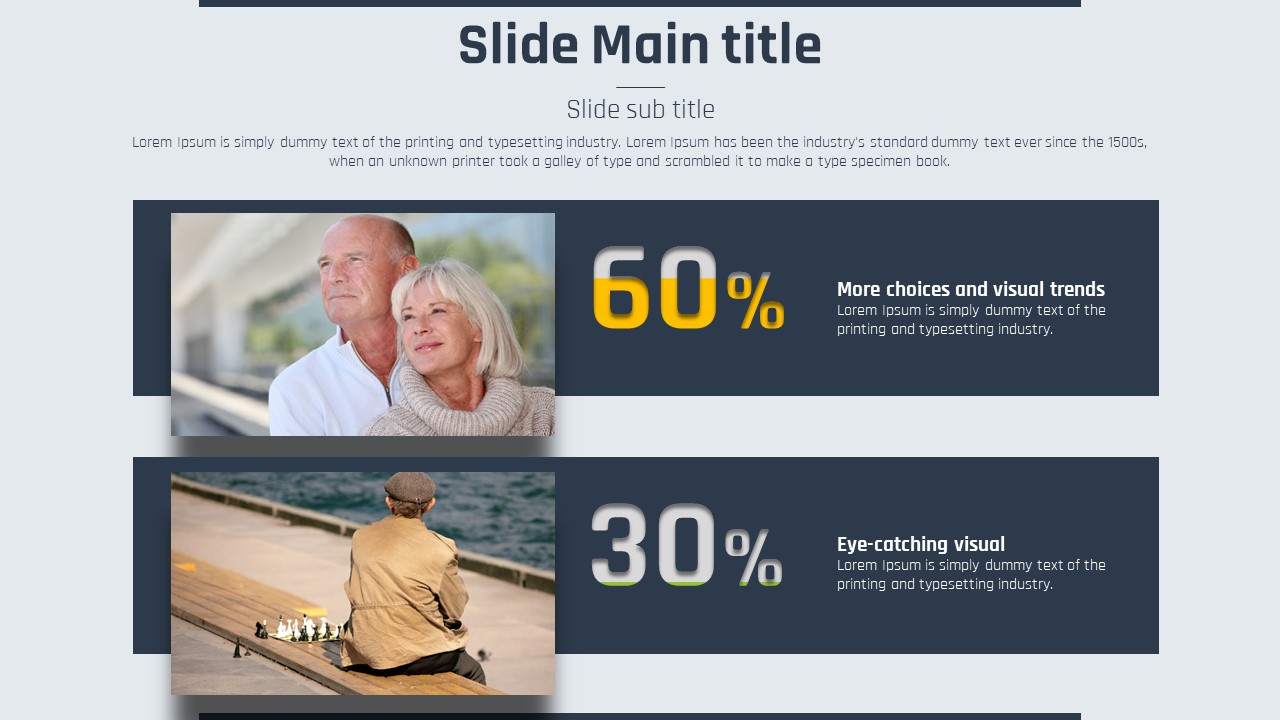
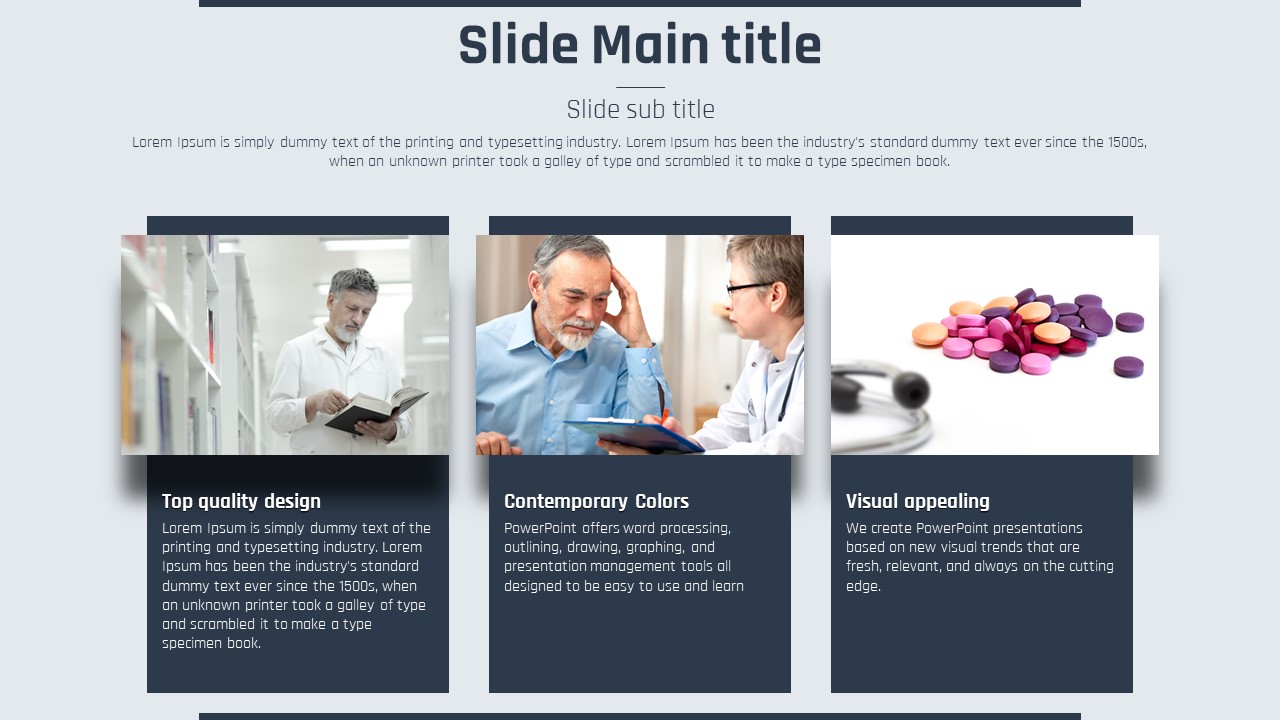
31 slides total: dark navy cover with pill photo and sky-blue banner, split-layout content slides (image + bar chart), three-step circular diagram, head silhouette infographic with four-panel text layout, and world map with regional bar charts for Americas, Europe, and Asia.
Related Products
-

Robot PPT Wide Template – Innovative Design and Efficiency
#Science/Medical
-

Science Experiment Presentation Template – Creative Visual and Design
#Science/Medical
-

Astronomy Presentation Template – Stylish Design for Exploring the Universe
#Science/Medical
-

Plastic Surgery Presentation Template – Professional Visual Representation
#Science/Medical
