Drug Addiction Treatment Analysis Diagram
RJ0400047_25
- Last Update 05/30/2025
- File Size 2MB
- # of Slides 2
- File Format PPTX
- Slide Ratio 16:9
- Color
Keywords
About the Product
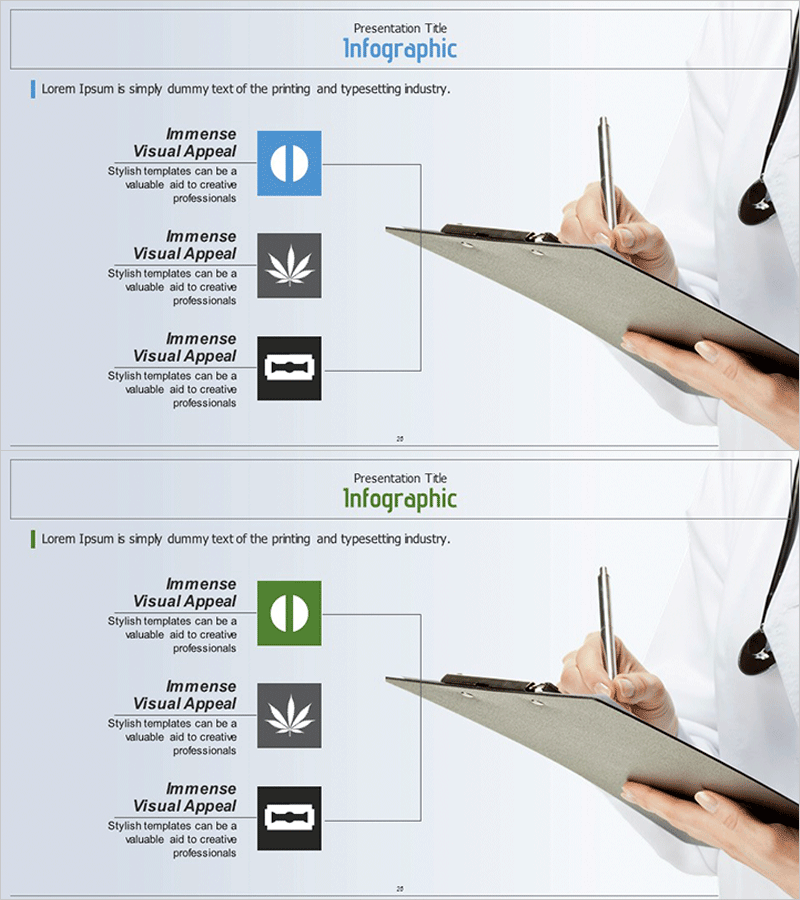
A 3-node connection diagram PowerPoint slide designed for healthcare and medical treatment process analysis. Features blue and green icon sets with text description areas and connecting lines that clearly express relationships between nodes. Provided in 16:9 widescreen format with 2 slides, ready for immediate use in hospital presentations, clinical research conferences, and healthcare education. Customize each node's icons and text to fit various analytical topics and medical scenarios.
Usage Points
-
Main Usage
Optimized for visualizing relationships and connection structures between three elements in medical treatment processes, clinical analysis, and healthcare education. Modify node text and icons to represent disease treatment stages, medical service coordination, patient management workflows, and other analytical topics relevant to healthcare settings.
-
How to Use
Open the slide and click each node's text box to enter titles and descriptions. Icons can be recolored using PowerPoint shape editing tools, and connecting lines can be adjusted for thickness and style. Use directly in hospital presentations, academic seminars, and clinical training materials, or insert into existing presentations for enhanced visual communication.
-
Recommended For
Healthcare professionals, nurses, health educators, clinical researchers, hospital administrators, and public health officials presenting treatment processes, patient management systems, and medical service coordination structures. Ideal for hospital training sessions, academic conferences, medical symposiums, and healthcare policy reports requiring clear visualization of complex relationships.
-
Slide Structure
Two-slide set with 3 nodes (including icons) arranged centrally or left-aligned on each slide, connected by relationship lines. Right side features hand-writing imagery and pen illustrations for practical, field-oriented atmosphere. First slide uses blue color scheme and second slide uses green scheme, allowing topic differentiation and visual variety in presentations.
Related Products
-

Detailed Plan Diffusion Diagram – Business Strategy and Direction
#Business Introduction #Business Vision and Strategy #Diagram
-

Business Overview and Area Diagram – Blue and Orange
#Business Introduction #Business Vision and Strategy #Diagram
-

Service Overview and Goals Green Navy Presentation Template
#Business Introduction #Business Vision and Strategy #Diagram
-

Science Experiment Core Goals Diagram – Strategic Business Design
#Business Introduction #Business Vision and Strategy #Diagram
