Blue Green Vertical Bar Graph – A Powerful Tool for Market Analysis
RJ0400047_18
- Last Update 05/30/2025
- File Size 1.5MB
- # of Slides 2
- File Format PPTX
- Slide Ratio 16:9
- Color
Keywords
- #Content-Based Slides
- #Design-Based Slides
- #Market and Competitor Analysis
- #Graph
- #Competitor Analysis
- #Market Analysis
- #Column
- #Grouped Column
- #16:9
- #clustered vertical bar chart PowerPoint
- #multi-series data comparison slide
- #market analysis chart template
- #how to create clustered bar chart in PowerPoint
- #data visualization slide download
About the Product
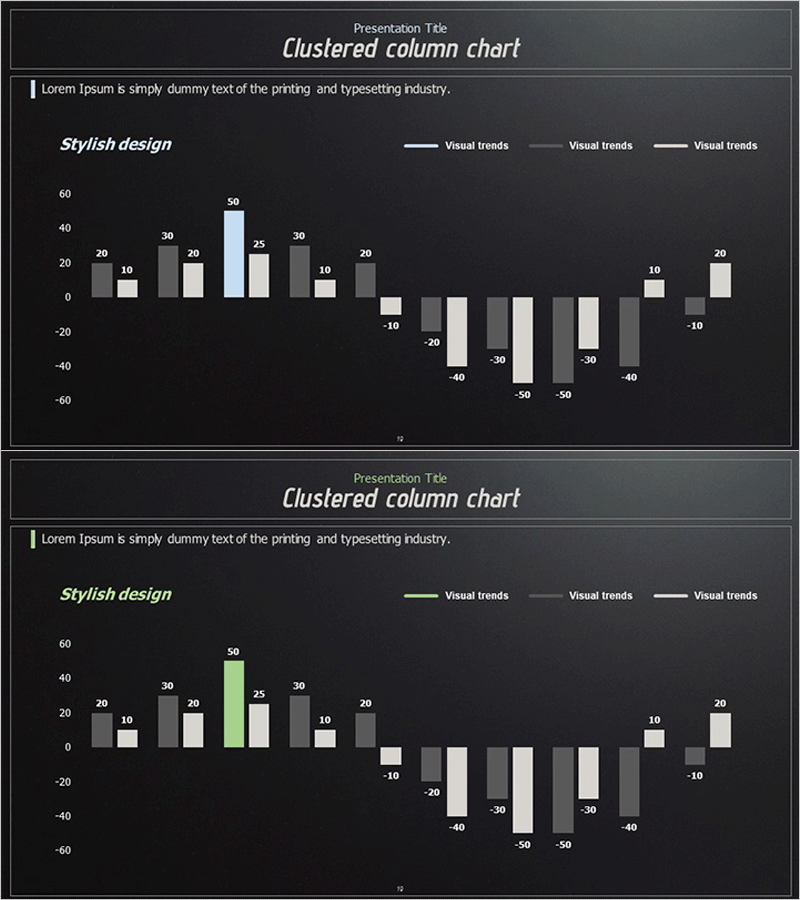
A clustered vertical bar chart PowerPoint slide optimized for market analysis and competitive benchmarking. The dark background features blue, green, and gray bars grouped together, enabling simultaneous comparison of multiple metrics. The structure accommodates both positive and negative values, making it ideal for trend analysis and performance evaluation. Clear legends and data labels ensure immediate applicability in presentations and reports. The 2-slide set allows you to present multiple datasets in a single deck.
Usage Points
-
Main Usage
Compares three or more data series across multiple categories simultaneously. Designed to display market share, quarterly revenue, competitive performance metrics, and other complex indicators at a glance.
-
How to Use
Each bar group represents a category, while color-coded bars represent different data series. Positive values display above the axis, negative values below, clearly showing growth and decline trends. Reference the legend to explain each series during your presentation.
-
Recommended For
Marketing professionals, financial analysts, and executives preparing performance reports. Ideal for quarterly results comparison, product line sales analysis, and competitive benchmarking presentations.
-
Slide Structure
2-slide set. Each slide features a dark background with blue, green, and gray vertical bars grouped by category. Approximately 10–12 category groups with 3 bars per group. Both positive and negative values represented. Includes legend and data labels.
Related Products
-

Market Analysis Bundle Vertical Bar Graph – Effective Data Visualization
#Market and Competitor Analysis #Graph #Competitor Analysis
-

Space Exploration Analysis Bar Graph
#Market and Competitor Analysis #Graph #Competitor Analysis
-

Paper Theme Table Chart & Bar Graph – Market Analysis and Competitive Strength
#Market and Competitor Analysis #Diagram #Graph
-

Comparative Analysis of Vertical Bar Bundles
#Market and Competitor Analysis #Graph #Competitor Analysis
