Drug Addiction Treatment Solutions – Multidirectional Flow Diagram
RJ0400047_26
- Last Update 05/30/2025
- File Size 0.9MB
- # of Slides 2
- File Format PPTX
- Slide Ratio 16:9
- Color
Keywords
- #Content-Based Slides
- #Design-Based Slides
- #Business Vision and Strategy
- #Business Strategy
- #Diagram
- #Business Goals
- #Business Direction
- #Flow
- #Cluster
- #Multidirectional Flow
- #Chain Diagram
- #16:9
- #multidirectional diagram PowerPoint
- #flow chart slide template
- #4-node connection diagram
- #arrow process PPT
- #business direction slide
- #how to create flow diagram in PowerPoint
About the Product
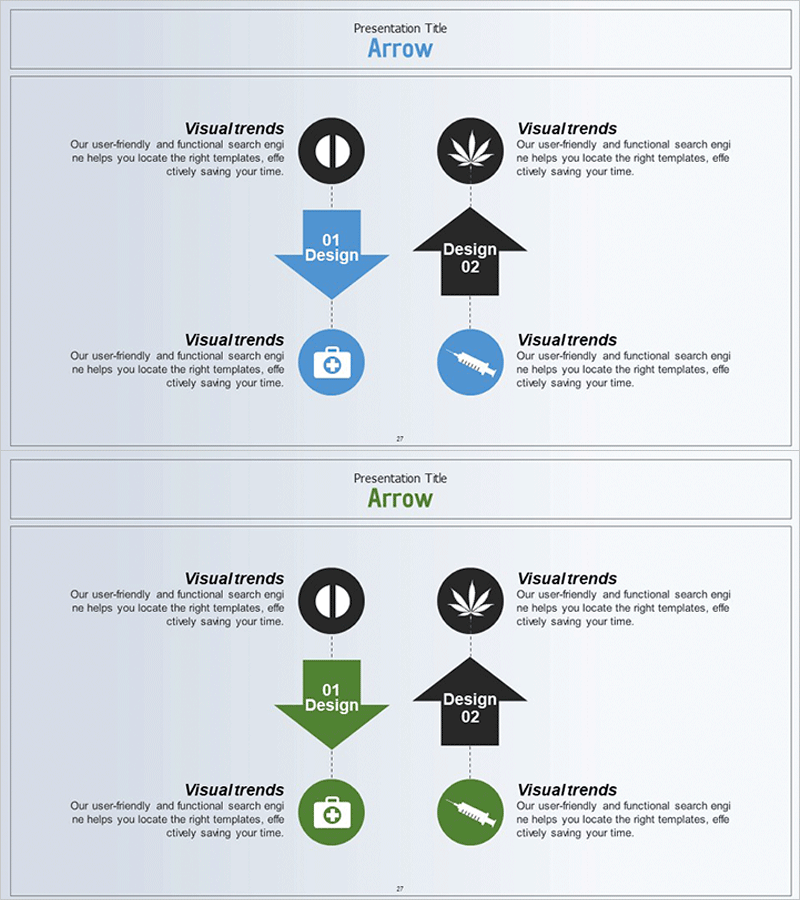
A multidirectional flow diagram PowerPoint slide featuring four nodes connected by arrows radiating from a central concept. This slide design is ideal for visualizing business directions, solution frameworks, process stages, and strategic initiatives. The two-tone color scheme of blue and black creates clear information hierarchy, with editable icon areas and text fields in each node. The 2-slide set supports flexible content combinations for presentations and reports.
Usage Points
-
Main Usage
This diagram expresses multidirectional flow from a central concept to four surrounding nodes, making it ideal for presenting business directions, problem-solving approaches, process stages, and organizational responsibilities. Each node is independently editable, allowing flexible adaptation to various presentation contexts.
-
How to Use
Enter your core topic in the central box and add detailed items to the four surrounding nodes. Replace node icons to visually distinguish categories and information types. Adjust arrow colors and node background colors to match your brand identity and presentation theme.
-
Recommended For
Executives, strategic planners, and marketing teams can use this slide when presenting business strategies, marketing rollout plans, and organizational initiatives. It works well in consulting proposals, business plans, and marketing strategy documents to explain multifaceted approaches.
-
Slide Structure
2-slide set with identical layouts. Each slide features one central node connected to four surrounding nodes via directional arrows. Blue arrows, black nodes, circular icon areas, and text input boxes are arranged in a 16:9 widescreen format optimized for modern presentations.
Related Products
-

Speech Connection Diagram – Vision and Strategy
#Business Vision and Strategy #Business Strategy #Diagram
-

Multidirectional Diagram Slide Visualizing Diverse Business Strategies
#Business Vision and Strategy #Business Strategy #Diagram
-

Differentiated Business Objectives – Infographic Slide for Clear Business Goals
#Business Vision and Strategy #Business Strategy #Diagram
-

Flow Diagram with Objectives – Strategy and Direction
#Business Vision and Strategy #Business Strategy #Diagram
