Diagram Explaining Dangerous Drug Ingredients
RJ0400047_8
- Last Update 05/30/2025
- File Size 1.5MB
- # of Slides 2
- File Format PPTX
- Slide Ratio 16:9
- Color
Keywords
- #Content-Based Slides
- #Design-Based Slides
- #Company Introduction
- #Business Vision and Strategy
- #Diagram
- #Business Areas
- #Business Vision
- #Cluster
- #Chain Diagram
- #16:9
- #radial diagram PowerPoint
- #connection diagram slide
- #central concept expansion
- #business process diagram
- #how to create radial diagram in PowerPoint
- #4-way flow chart template
About the Product
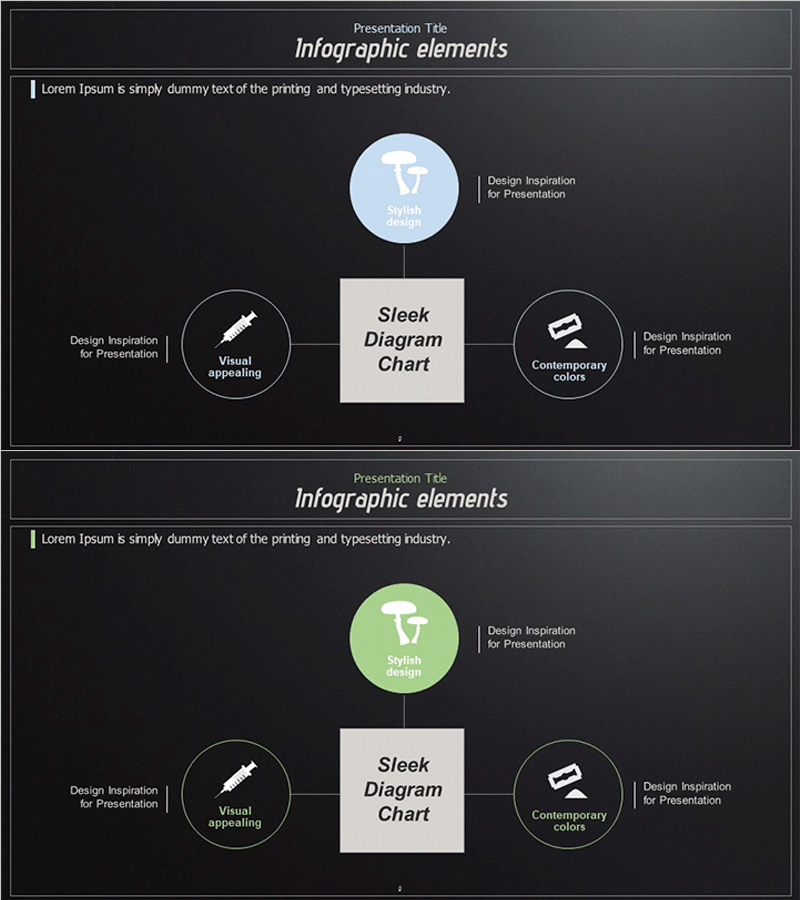
A radial connection diagram PowerPoint slide featuring a central concept expanding outward to four directional nodes. The design uses a dark gray background with light blue and lime green circular nodes, a beige central rectangular box, and connecting lines with directional arrows. Each node includes icon placeholders and text labels for clear information hierarchy. This slide template is ideal for business strategy presentations, organizational structures, process flows, and concept mapping. The 2-slide set provides color variations in blue and green tones, formatted in 16:9 widescreen PPTX for immediate editing and deployment.
Usage Points
-
Main Usage
Visually represents a core concept or strategy with four key elements, domains, or phases branching outward. The central box holds the main topic while four surrounding circular nodes display supporting details, clearly communicating hierarchical relationships and expansion structures.
-
How to Use
Apply this diagram in business vision and strategy presentations to show a central goal with four implementation pillars, or in organizational charts to illustrate a headquarters with four departments. Customize node text and icons for marketing frameworks (4Ps), management priorities, product features, or any four-component model relevant to your presentation.
-
Recommended For
Executives, planning teams, marketing departments, and strategy professionals presenting business plans, organizational restructuring, or process improvements. Educational institutions can use it to map learning objectives with four subject areas, while consulting firms can present client challenges alongside four solution approaches.
-
Slide Structure
Dark gray background with a central beige rectangular box (title input area) and four circular nodes positioned at top, left, right, and bottom. Each circular node contains icon space and text label area. Linear connecting lines extend from the central box to each node, representing information flow. The 2-slide set maintains identical structure with light blue and lime green color variations.
Related Products
-

Oriental Medicine Business Area Diagram – Visualization of Vision and Strategy
#Company Introduction #Business Vision and Strategy #Diagram
-

Travelling Around the World Infographic – Capturing Business Vision and Strategy
#Business Vision and Strategy #Diagram #Business Vision
-

Aging Causes Characteristics Diagram – Business Presentation
#Company Introduction #Product/Service Introduction #Diagram
-

Global Business Services Area – Cluster Diagram
#Company Introduction #Business Introduction #Diagram
