Drug Addiction Risk Analysis Graph Chart – Insightful Information Delivery
RJ0400047_14
- Last Update 05/29/2025
- File Size 1.5MB
- # of Slides 2
- File Format PPTX
- Slide Ratio 16:9
- Color
Keywords
- #Content-Based Slides
- #Design-Based Slides
- #Market and Competitor Analysis
- #Diagram
- #Graph
- #Market Analysis
- #Competitive Advantage
- #Table
- #Circles
- #Standard Table
- #Doughnut Chart
- #16:9
- #doughnut chart PowerPoint
- #donut graph slide template
- #pie chart presentation
- #ratio analysis PPT
- #data visualization slide
- #three-level chart download
About the Product
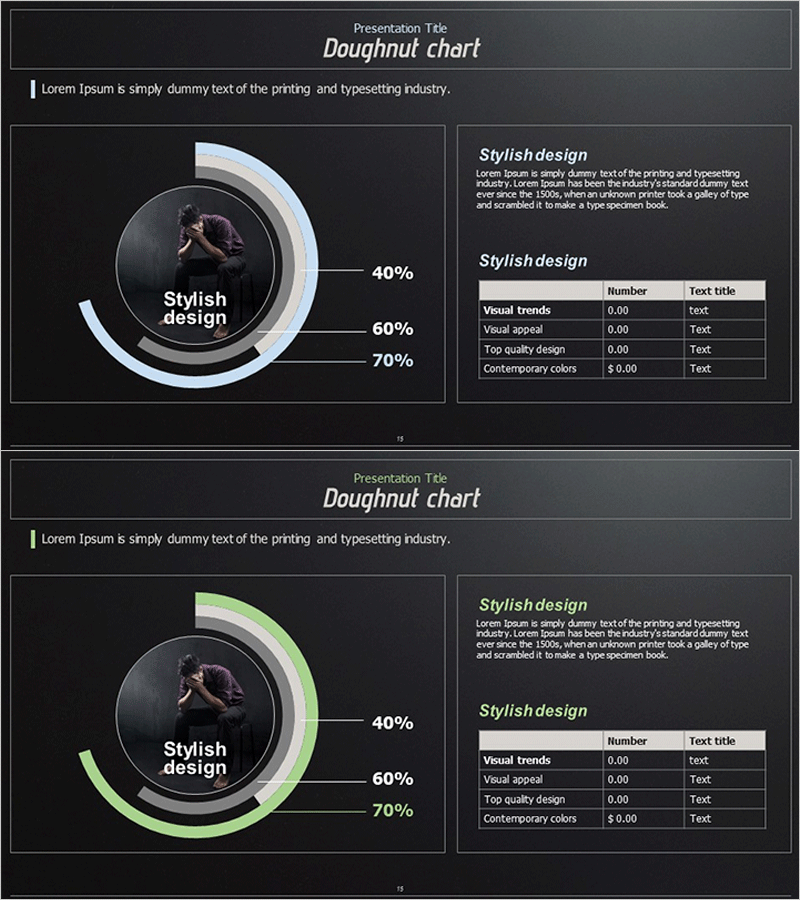
A doughnut chart PowerPoint slide that visualizes three-level ratio data (40%, 60%, 70%) with a central image and outer gradient rings in light blue and green tones. Set against a dark background, this design combines quantitative data representation with a supporting information table on the right side. The 2-slide set includes color variations in blue and green palettes, allowing you to match your presentation theme and brand colors. Ideal for delivering both numerical insights and contextual explanations in a single, visually balanced slide.
Usage Points
-
Main Usage
This slide effectively communicates quantitative ratio data alongside qualitative context. The central image area holds your key concept or subject, while the outer rings display three-level percentages (40%, 60%, 70%, etc.) to create a hierarchical information structure. The accompanying information table on the right reinforces data credibility and provides supporting details.
-
How to Use
Apply this slide to presentations requiring three-segment ratio analysis, such as market analysis, risk assessment, performance metrics, or customer satisfaction surveys. Replace the central image with your product, person, or icon, then update the ring percentages and labels with your actual data. The right-side table fields are fully editable to match your presentation content.
-
Recommended For
Marketing professionals, data analysts, executives preparing reports, management consultants, and educators benefit from this design when presenting quantitative findings persuasively. Particularly suited for risk evaluation, market share distribution, achievement rates, customer segmentation, or any scenario emphasizing three-part proportional breakdown.
-
Slide Structure
The slide features a two-column layout: left side contains the doughnut chart with a dark central image area and three outer gradient rings (blue or green), each marked with arrows and percentage labels; right side displays a title, descriptive text, and a four-row information table with columns for item name, numerical value, and text description.
Related Products
-

Type Comparison Analysis Graph & Table – Effective Tool for Market Analysis
#Market and Competitor Analysis #Diagram #Graph
-

Key Competitive Factors in Market Analysis – First Step Toward Competitive Advantage
#Market and Competitor Analysis #Diagram #Graph
-

Detailed Analysis in Book Illustration PowerPoint Template
#Market and Competitor Analysis #Diagram #Graph
-

Shareholder Status Analysis Chart & Description – Sleek Diagram
#Company Introduction #Market and Competitor Analysis #Diagram
