The Serious Problem of Drug Addiction – Infographic Featuring Clusters and Connections
RJ0400047_33
- Last Update 05/30/2025
- File Size 1MB
- # of Slides 2
- File Format PPTX
- Slide Ratio 16:9
- Color
Keywords
- #Content-Based Slides
- #Design-Based Slides
- #Product/Service Introduction
- #Business Vision and Strategy
- #Diagram
- #Features
- #Business Goals
- #Cluster
- #Chain Diagram
- #16:9
- #cluster diagram PowerPoint
- #connection diagram template
- #infographic slide
- #relationship diagram PPT
- #radial diagram slide
- #icon connection PowerPoint template
About the Product
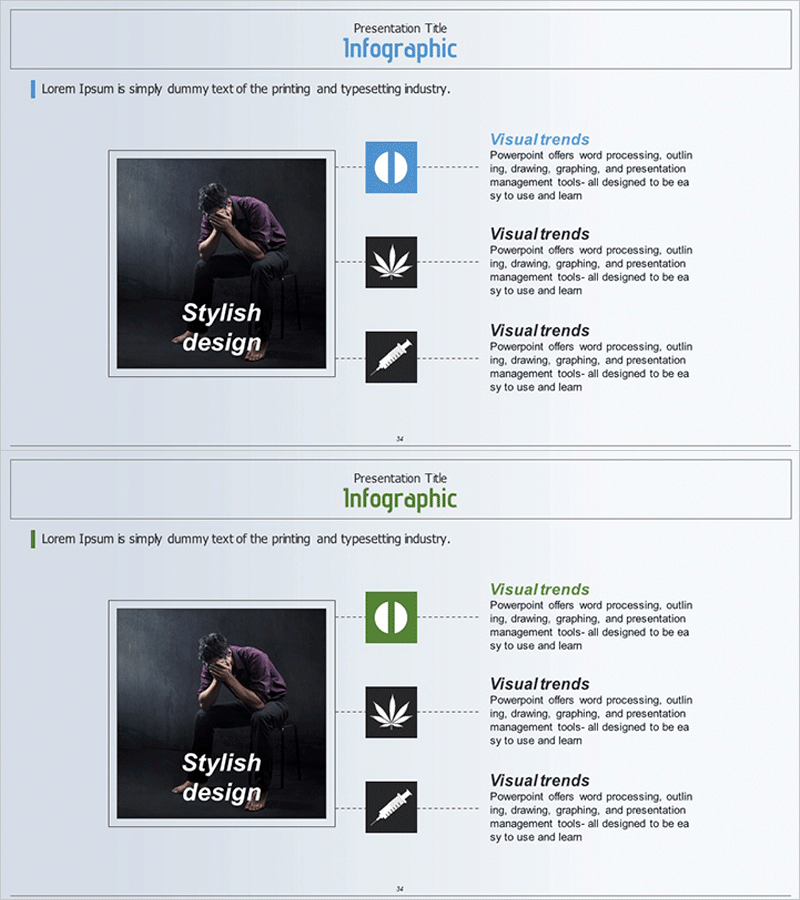
A cluster diagram PowerPoint slide featuring a central image connected to three icon nodes via dotted lines. The layout divides the slide into a left photo area and a right three-step connection structure, optimized for visualizing information hierarchy and relationships. Blue, black, and green icons distinguish each item, with ample text description areas for immediate use in presentations, educational materials, and reports. Provided in 16:9 widescreen format with 2 slides in PPTX, all shapes, colors, and text are fully editable.
Usage Points
-
Main Usage
Visualizes complex information by showing relationships between a central concept and surrounding items. Designed to present multi-layered data such as problem analysis, causal structures, impact scope, and organizational relationships at a glance.
-
How to Use
Place a key image or logo in the left photo area and enter detail items in the three right icon nodes. Add descriptions in the text area next to each node to complete the slide. All colors, icons, and text are fully customizable.
-
Recommended For
Ideal for educational, healthcare, and social sector presentations; problem analysis reports; causal structure explanations; organizational relationship diagrams; and marketing strategy analysis materials. Highly effective for lectures, seminars, and conference presentations.
-
Slide Structure
2-slide set. Each slide is divided into a left photo area (approximately 40%) and a right three-step connection structure (approximately 60%). Dotted arrow lines connect from the central node to three icon nodes, with text description areas positioned to the right of each node. Color coding uses blue, black, and green for distinction.
Related Products
-

Step-by-step Business Objectives Diagram – Execution Roadmap for Vision Realization
#Product/Service Introduction #Business Vision and Strategy #Diagram
-

Corn Shape Target Diagram – Visualizing Business Vision and Strategy
#Product/Service Introduction #Business Vision and Strategy #Diagram
-

Animal Farm Infographic Slide – Eye-Catching Design
#Product/Service Introduction #Diagram #Features
-

Watercolor Business Strategy Diagram - Clearly Define Business Goals
#Business Vision and Strategy #Diagram #Business Strategy
