Drug Addiction Gender Ratio Analysis Graph - Customer Analysis
RJ0400047_16
- Last Update 05/30/2025
- File Size 1.5MB
- # of Slides 2
- File Format PPTX
- Slide Ratio 16:9
- Color
Keywords
- #Content-Based Slides
- #Design-Based Slides
- #Market and Competitor Analysis
- #Graph
- #Other
- #Customer Analysis
- #Market Share
- #Circles
- #Pie Chart
- #Silhouette
- #16:9
- #pie chart PowerPoint slide
- #gender ratio analysis presentation
- #2-segment pie chart template
- #customer analysis slides
- #data visualization PowerPoint
About the Product
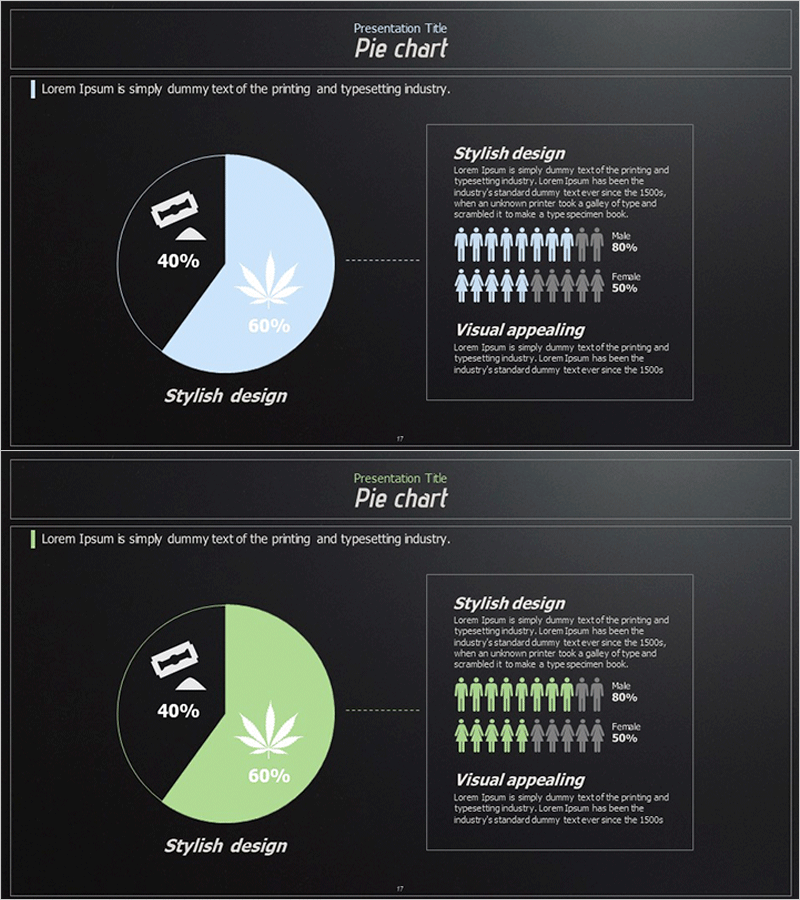
A 2-segment pie chart PowerPoint slide set designed for gender ratio and demographic analysis. The dark background features contrasting blue and lime green tones to clearly distinguish data segments, with percentage values and icons positioned in each section to enhance information clarity. The right panel includes a gender population silhouette graph that visually reinforces the ratio data. The 2-slide composition allows flexible representation of various ratio combinations, optimized for modern 16:9 widescreen presentations. Ready to use immediately for marketing analysis, customer segmentation, and market research presentations.
Usage Points
-
Main Usage
Visualizes binary demographic data such as gender, age group, or customer segment ratios using pie chart format. Ideal for marketing analysis, market research, and customer segmentation presentations, with the population silhouette graph reinforcing numerical percentages for intuitive audience understanding.
-
How to Use
Edit the pie chart segments and percentage values on each slide with your own data, and adjust the population silhouette graph proportions accordingly. Maintain the dark background and blue-lime color scheme or customize to match corporate branding. Add text labels and legends to clarify context and data sources.
-
Recommended For
Marketing professionals, market research analysts, HR specialists, business consultants, and academic presenters analyzing customer demographics, population statistics, and gender/age distribution data. Particularly effective for B2B marketing strategy presentations and customer segmentation reports.
-
Slide Structure
2-slide layout with left-aligned 2-segment pie chart (40%-60% ratio example), center dotted connector line, and right-aligned gender population silhouette graph (male/female icon matrix). 16:9 widescreen format with dark background, blue and lime green color contrast for segment distinction, and emphasized percentage values.
Related Products
-

Men's Recommended Daily Intake Visualization – A Slide for Healthy Men
#Market and Competitor Analysis #Graph #Customer Analysis
-

LMO Gender Comparison Analysis Graph – Market Share and Customer Analysis
#Market and Competitor Analysis #Other #Customer Analysis
-

Donut Type Male and Female Analysis Chart – Customer Preference Analysis
#Market and Competitor Analysis #Graph #Customer Analysis
-

Human Analysis Chart – Visualizing Customer Analysis and Market Share
#Market and Competitor Analysis #Graph #Other
