Drug Addiction Treatment Process – Understanding with Cluster Diagram
RJ0400047_27
- Last Update 05/30/2025
- File Size 1.9MB
- # of Slides 2
- File Format PPTX
- Slide Ratio 16:9
- Color
Keywords
About the Product
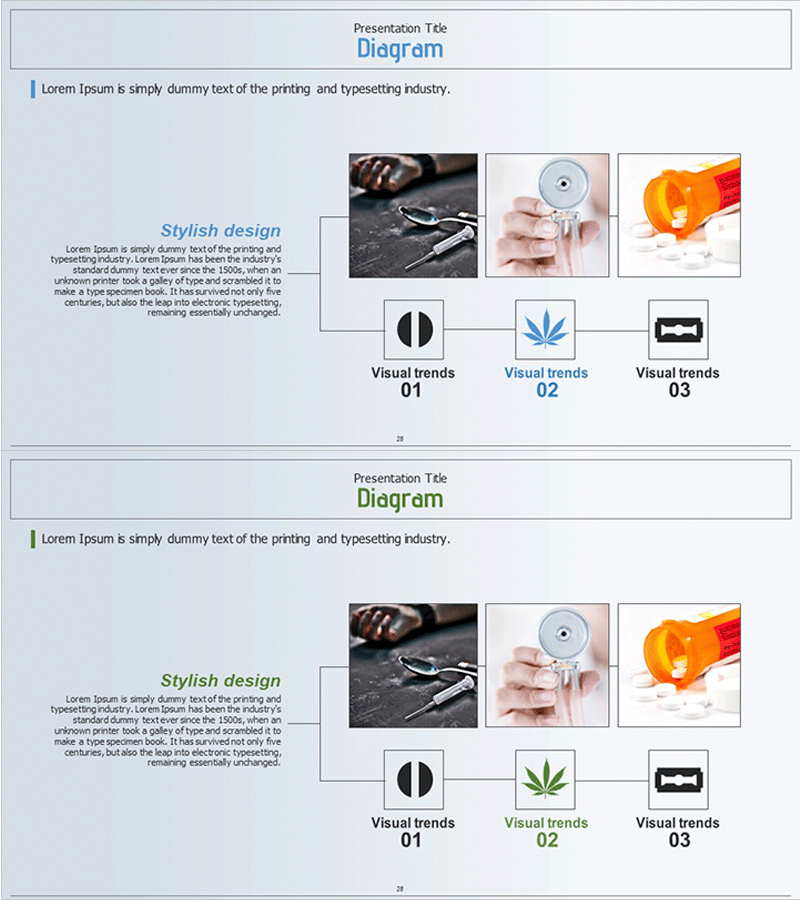
A radial cluster diagram PowerPoint slide with 6 interconnected nodes expanding from a central concept. Features a left text area, three image boxes on the right, and six icon nodes at the bottom connected by lines, ideal for visualizing processes, treatment stages, organizational relationships, and concept expansion. Light blue background with white boxes and black connection lines clearly express information hierarchy. Each node accepts text and images for flexible customization. Delivered as a 2-slide 16:9 PPTX file ready for immediate editing and presentation use.
Usage Points
-
Main Usage
Visualizes relationships expanding from a central concept to surrounding elements using a cluster diagram structure. Effectively represents addiction treatment processes, organizational hierarchies, concept classifications, and connections between core topics and detailed items. The 6-node layout organizes complex information hierarchically and enhances audience comprehension.
-
How to Use
Enter core explanations in the left 'Stylish design' text area and insert relevant photos into the three right-side image boxes. Add stage or item names to the six bottom icon nodes and adjust colors for emphasis. Ideal for medical presentations, educational seminars, and business proposals to clearly communicate complex concepts.
-
Recommended For
Healthcare professionals explaining addiction treatment processes, educators teaching concept relationships, consultants presenting organizational structures and strategies, marketing managers mapping customer journeys, and researchers visualizing data classifications and relationship diagrams. Suitable for academic presentations, clinical training, organizational restructuring explanations, and strategic planning meetings.
-
Slide Structure
2-slide layout. Slide 1: Title area + left text box + three right-side image areas + six bottom icon nodes connected by black lines to center. Slide 2: Identical layout in green color variant. Each node is independently editable with flexible text, color, and size adjustments.
Related Products
-

Space Business Connection Diagram – Visually Delivering Information
#Company Introduction #Product/Service Introduction #Diagram
-

Research and Development Overview Diagram – Innovation and Progress
#Company Introduction #Product/Service Introduction #Diagram
-

Pictogram History Diagram – Visual Timeline for Company Introduction
#Company Introduction #Product/Service Introduction #Diagram
-

Corporate History on the Path to Success
#Company Introduction #Product/Service Introduction #Diagram
