Comparative Analysis Vertical Bar Graph – Gaining Competitive Advantage through Market Analysis
RJ0400047_7
- Last Update 05/30/2025
- File Size 1.5MB
- # of Slides 2
- File Format PPTX
- Slide Ratio 16:9
- Color
Keywords
- #Content-Based Slides
- #Design-Based Slides
- #Market and Competitor Analysis
- #Graph
- #Competitor Analysis
- #Market Analysis
- #Column
- #Column Chart
- #16:9
- #vertical bar chart PowerPoint
- #comparative analysis slide template
- #competitor analysis chart
- #market analysis graph
- #bar chart PowerPoint slide download
About the Product
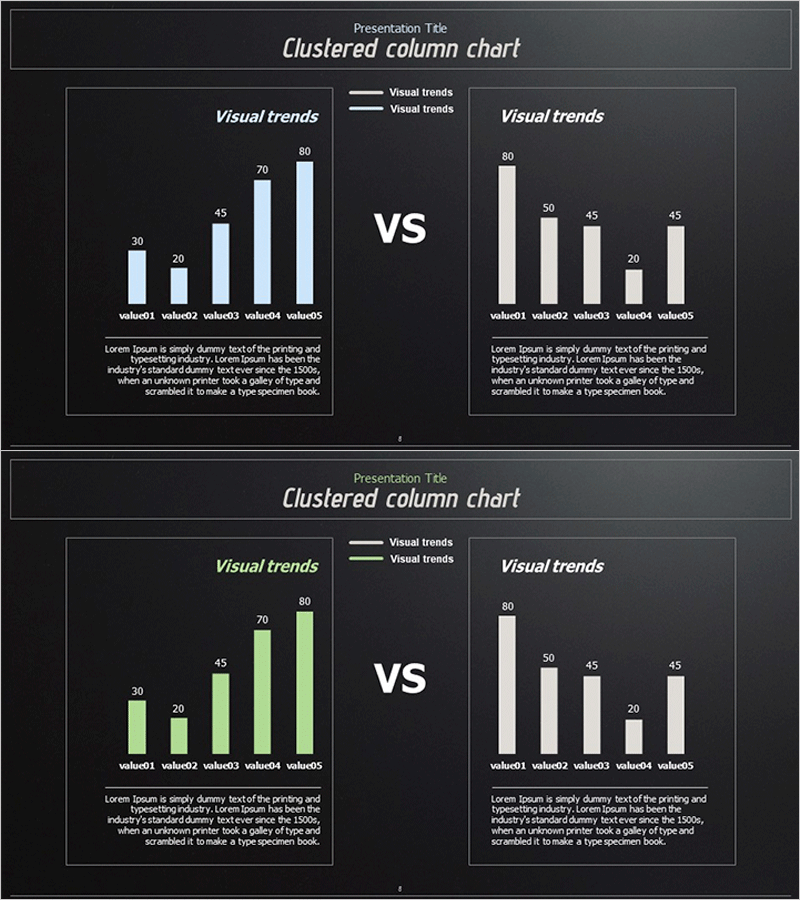
A vertical bar chart PowerPoint slide optimized for market analysis and competitive comparison. The layout features two chart areas positioned side-by-side, each displaying five data items for intuitive group-to-group numerical comparison. Set against a dark background with white and lime green bar colors for strong visual contrast, the slide includes a legend and clear information hierarchy. This PowerPoint slide template is ready to use in business presentations, performance reports, marketing strategy decks, and data-driven decision-making scenarios.
Usage Points
-
Main Usage
Designed to visualize numerical comparisons between two groups or datasets. Ideal for presenting market share, sales volume, performance metrics, and other quantitative data in a symmetrical left-right structure that reveals competitive advantage at a glance.
-
How to Use
Enter company data on the left chart and competitor data on the right, or arrange comparison data by time period, region, or product category. Modify the legend for item names and update bar heights and values to instantly create presentation-ready slides.
-
Recommended For
Marketing professionals, strategy planners, sales managers, financial analysts, and data-driven decision makers. Effective for quarterly performance reviews, market entry strategy presentations, competitive analysis meetings, and business intelligence reports.
-
Slide Structure
Two-slide set. Each slide is divided into left and right chart areas, with each chart containing five vertical bar graph items, numerical labels, and a legend. A central 'VS' text element clarifies the comparative intent.
Related Products
-

Concise Analysis Column Graph & Table Slide
#Market and Competitor Analysis #Diagram #Graph
-

Vertical Bar Standard Color Chart for Market Analysis – Market and Competitor Analysis
#Market and Competitor Analysis #Graph #Competitor Analysis
-

Pie & Bar Analysis Graphs – Optimized for Market and Competitor Analysis
#Market and Competitor Analysis #Graph #Competitor Analysis
-

Competitor and Market Analysis Slide Design - Harmony of Blue and Yellow
#Market and Competitor Analysis #Diagram #Graph
