Gender Comparative Analysis Detailed Graph – Market and Customer Insights
RJ0400047_23
- Last Update 05/30/2025
- File Size 0.9MB
- # of Slides 2
- File Format PPTX
- Slide Ratio 16:9
- Color
Keywords
- #Content-Based Slides
- #Design-Based Slides
- #Market and Competitor Analysis
- #Graph
- #Other
- #Customer Analysis
- #Column
- #Segmented Column
- #Silhouette
- #16:9
- #100% stacked column chart PowerPoint
- #gender comparative analysis slide
- #market analysis chart template
- #customer segmentation presentation
- #stacked bar graph download
About the Product
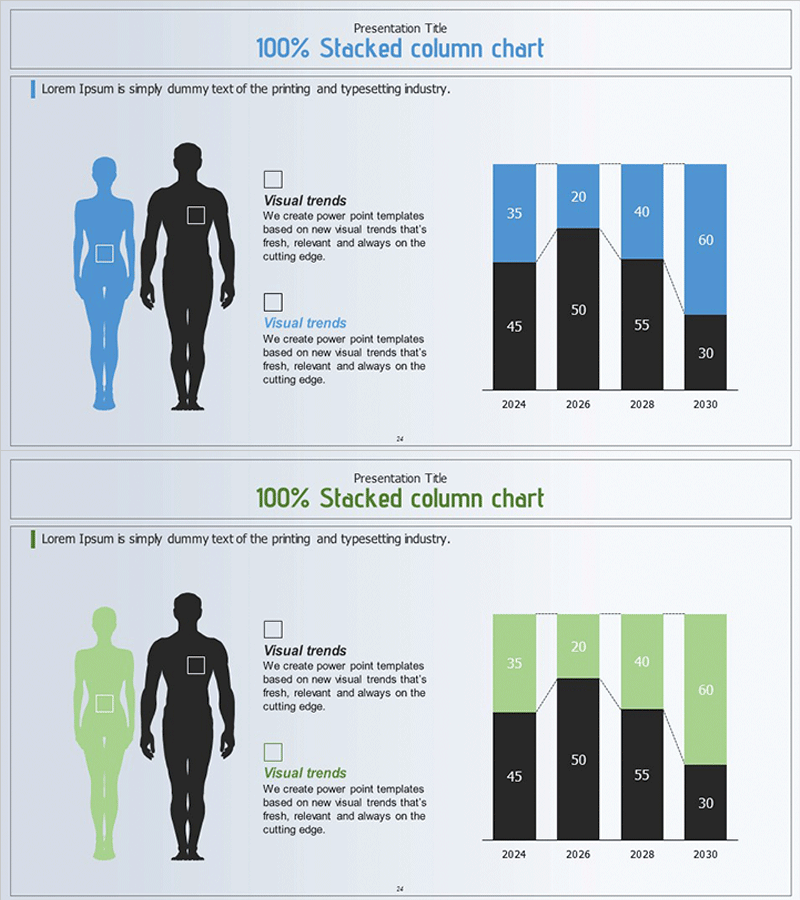
A 100% stacked column chart PowerPoint slide designed for gender-based comparative analysis and market insights. Features male and female silhouette icons paired with a four-year data visualization (2024–2030) in blue and green dual-tone color schemes. Each column is segmented into two data series with numeric labels, making it ideal for market research, customer segmentation, and business intelligence presentations. Provided in 16:9 PPTX format with fully editable elements including icons, labels, and color fills.
Usage Points
-
Main Usage
This stacked column chart slide is designed to compare categorical data such as gender, age group, or region. The segmented columns display both absolute values and proportional composition simultaneously, making it perfect for market research reports, customer demographic analysis, sales performance reviews, and strategic business presentations requiring multi-dimensional data visualization.
-
How to Use
Replace the sample numeric values with your actual data and update year labels or category names as needed. The silhouette icons can be swapped for other symbols representing job titles, departments, or customer segments. All colors are fully customizable to match your brand guidelines. Text boxes and shapes are editable, allowing you to add annotations, callouts, or additional emphasis as required.
-
Recommended For
Ideal for marketing teams presenting market analysis reports, sales teams showcasing customer segmentation strategies, executive-level performance review meetings, and consulting proposals requiring data visualization. Particularly effective for consumer goods, financial services, telecommunications, and retail industries where gender-based or demographic comparative analysis is essential.
-
Slide Structure
Two-slide layout with male and female silhouette icons (blue and black dual-tone) positioned on the left, and a 100% stacked column chart on the right displaying four years of data (2024, 2026, 2028, 2030). Each column is divided into two segments with numeric labels (35, 45, 20, 50, 55, 40, 60, 30). The slide title clearly identifies the chart type as '100% Stacked column chart' for immediate recognition.
Related Products
-

Orange Hexagon Presentation Template Segmented Vertical Bar Graph – Market and Competitive Analysis
#Market and Competitor Analysis #Graph #Other
-

Human Details Infographic Chart – Customer Analysis and Market Overview
#Market and Competitor Analysis #Graph #Other
-

Brain Structure Diffusion Diagram
#Market and Competitor Analysis #Diagram #Other
-

Travel Business Target Market and Customer Analysis Slide
#Market and Competitor Analysis #Graph #Other
