Drug Addiction Vicious Cycle Diagram – Issues and Solutions
RJ0400047_32
- Last Update 05/30/2025
- File Size 1.7MB
- # of Slides 2
- File Format PPTX
- Slide Ratio 16:9
- Color
Keywords
- #Content-Based Slides
- #Design-Based Slides
- #Product/Service Introduction
- #Diagram
- #Differentiation Strategy for Products/Services
- #Flow
- #Circular Flow
- #16:9
- #circular diagram PowerPoint
- #arrow diagram slide template
- #vicious cycle diagram
- #bidirectional flow presentation
- #addiction recovery slide
- #problem-solution diagram PowerPoint
About the Product
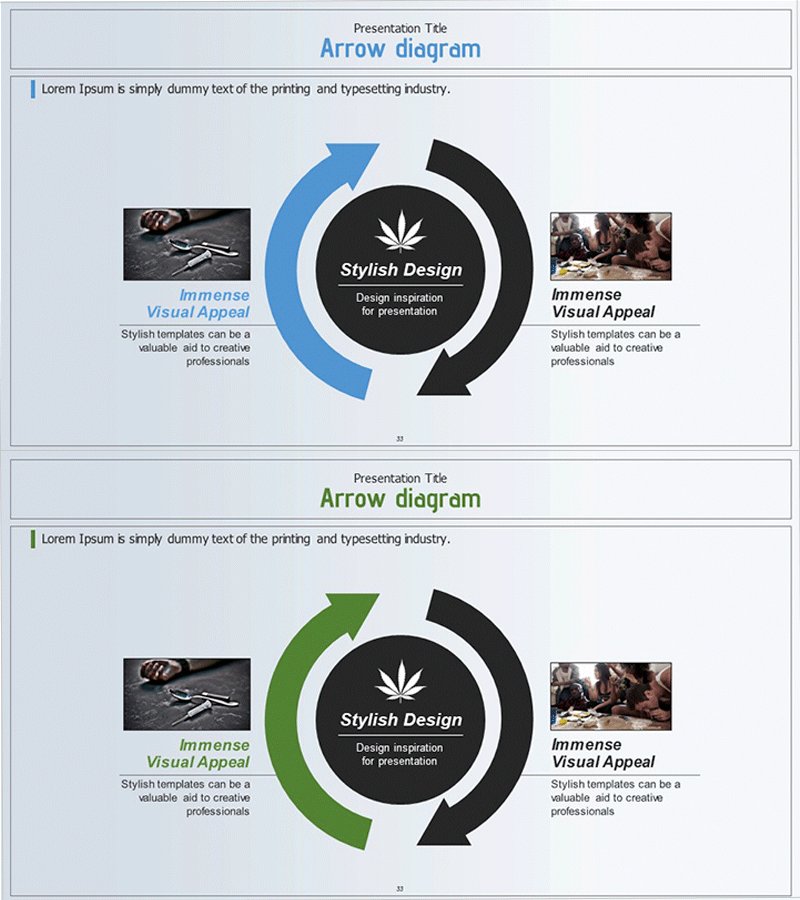
A circular arrow diagram PowerPoint slide that visualizes the vicious cycle of drug addiction through bidirectional flow. The design features a central black circular node with blue and black curved arrows flowing outward in opposite directions, flanked by image and text areas on both sides. This 2-slide set effectively illustrates cause-and-effect relationships, problem-solution pairs, and cyclical processes. Ideal for addiction recovery presentations, social issue analysis, and structural problem explanations. Delivered in 16:9 widescreen PPTX format with fully editable colors, text, and layout elements.
Usage Points
-
Main Usage
This slide clearly expresses cyclical structures and vicious cycles using bidirectional arrows. The blue and black curved arrows emanate from a central black node, spreading left and right to intuitively convey cause-effect relationships and problem-solution pairs. Optimized for addiction recovery programs, social issue analysis, and structural problem presentations.
-
How to Use
Enter the core topic (e.g., drug addiction) in the central black circular node. Fill the left arrow area with problem context (causes, symptoms, negative impacts) and the right arrow area with solutions (treatment, recovery, prevention). Insert relevant images in the left and right image zones to enhance visual impact. Freely customize colors and text sizes to match your presentation theme.
-
Recommended For
Social workers and counselors presenting addiction recovery programs, educational institutions conducting drug abuse prevention training, policymakers analyzing social issues, nonprofit organizations explaining cyclical structures, and corporate training teams demonstrating problem-solving processes.
-
Slide Structure
2-slide set with each slide featuring a central black circular node (core topic input area) and curved bidirectional arrows (blue and black) flowing outward on both sides. Image insertion areas and text boxes (title and description) are positioned symmetrically on the left and right, enabling balanced information layout. Optimized for 16:9 widescreen format in modern presentation environments.
Related Products
-

Service Differentiation Strategy Circular Diagram
#Product/Service Introduction #Marketing Plan and Strategy #Diagram
-

Ice Hockey Circulation Diagram - Product and Service Execution Strategy
#Product/Service Introduction #Technical Approach #Diagram
-

Banking Service System Configuration Diagram – Technological Differentiation
#Product/Service Introduction #Technical Approach #Diagram
-

Global Network Service Configuration Diagram – Product Differentiation Strategy
#Product/Service Introduction #Technical Approach #Diagram
