Research Data PPT – Stylish Scientific Design
J0700026
- Last Update 01/26/2025
- File Size 13.4MB
- # of Slides 30
- File Format PPTX
- Slide Ratio 16:9
- Color
Slide Preview


Keywords
About the Product
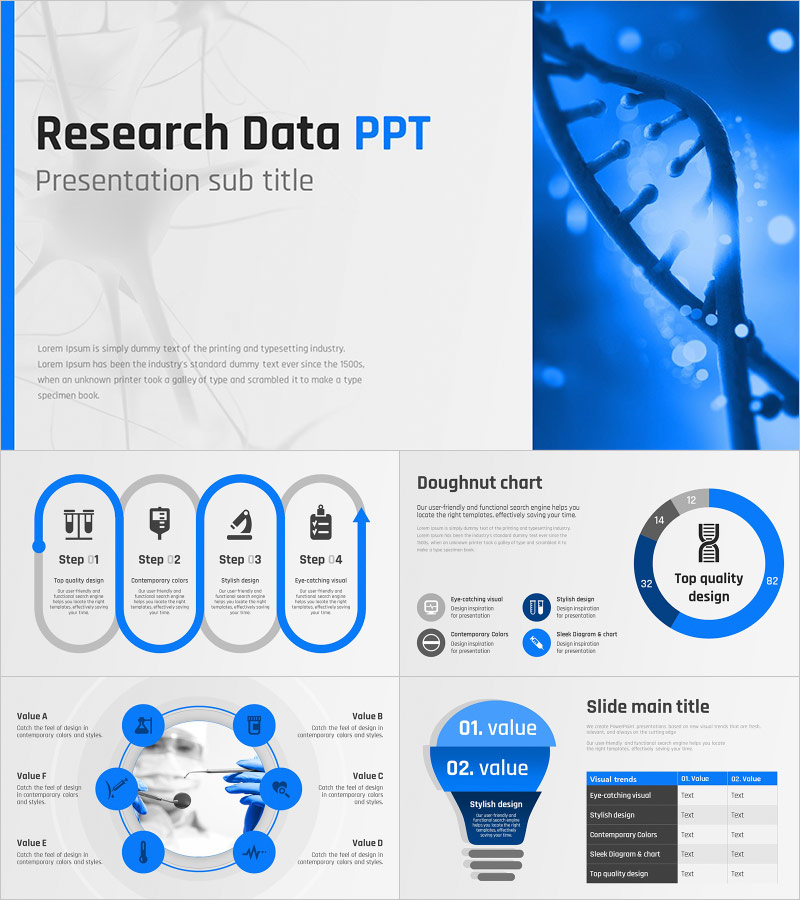
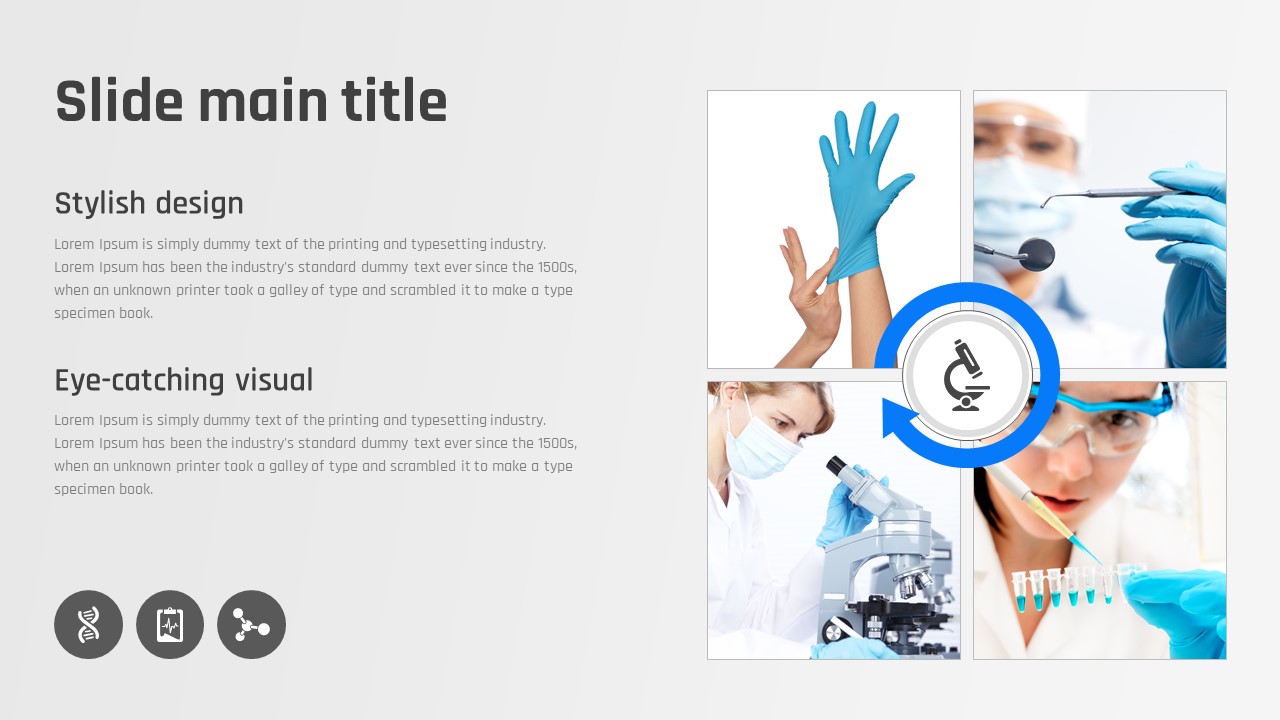
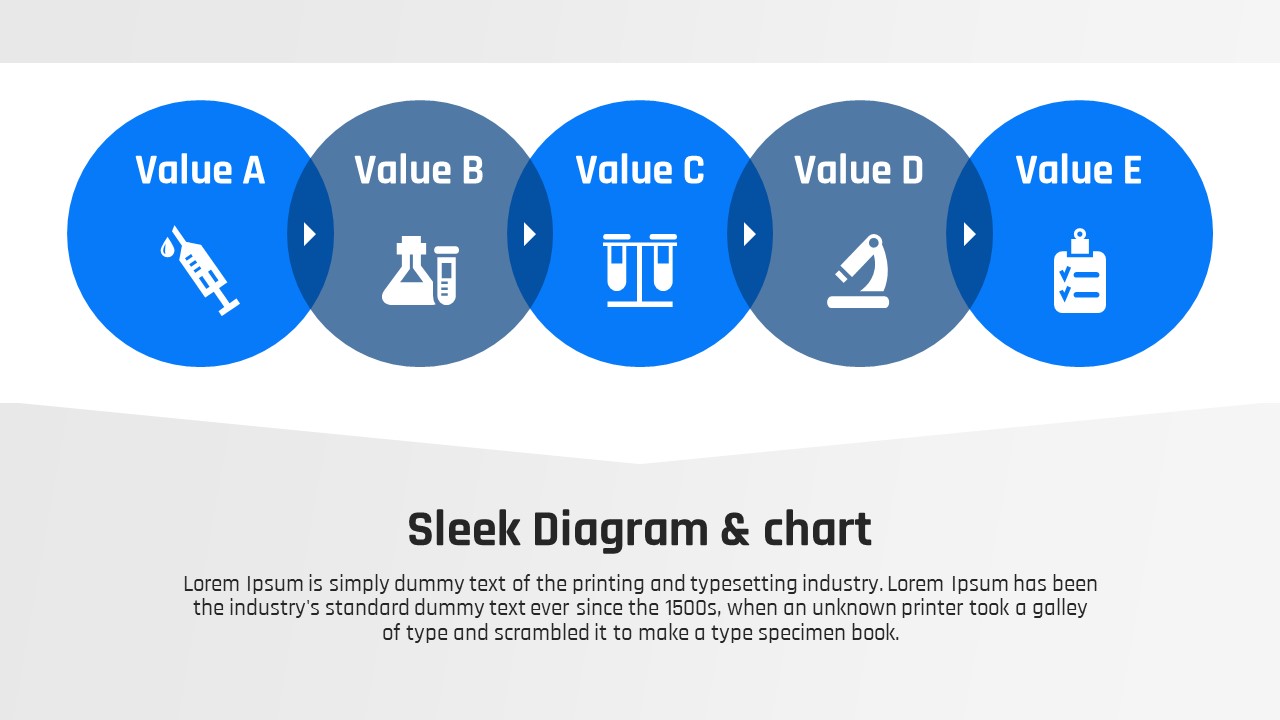
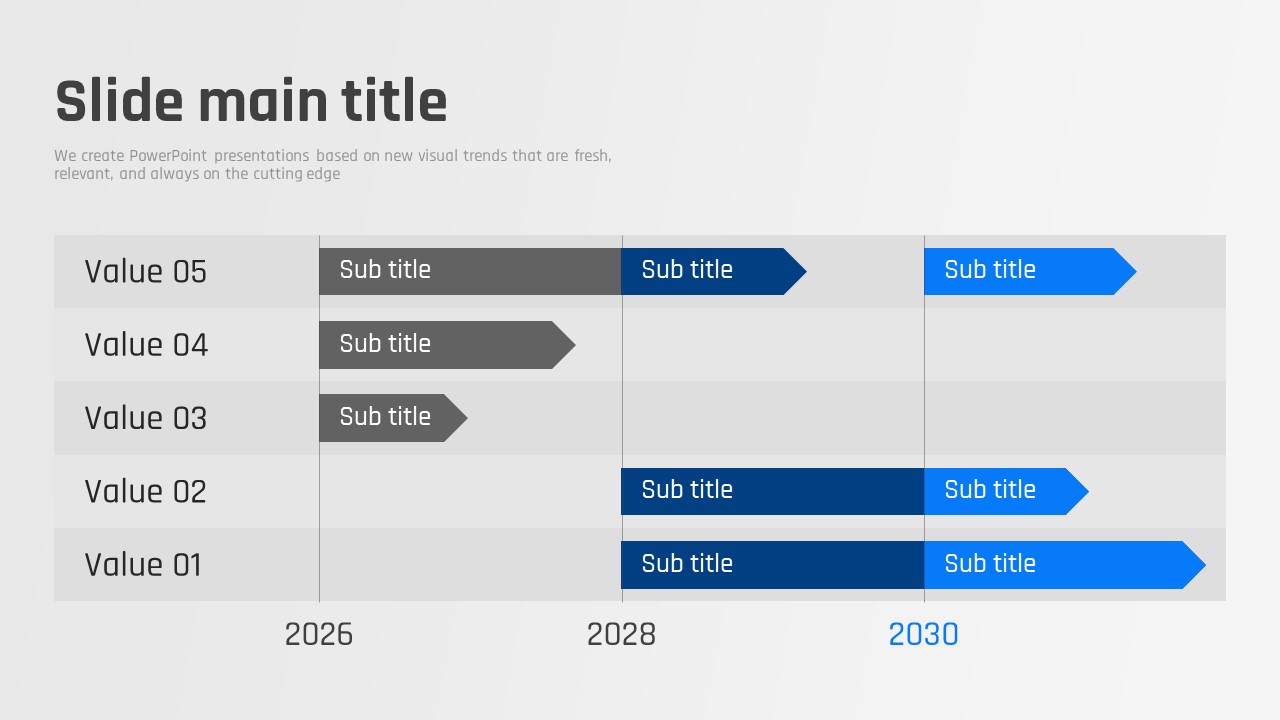
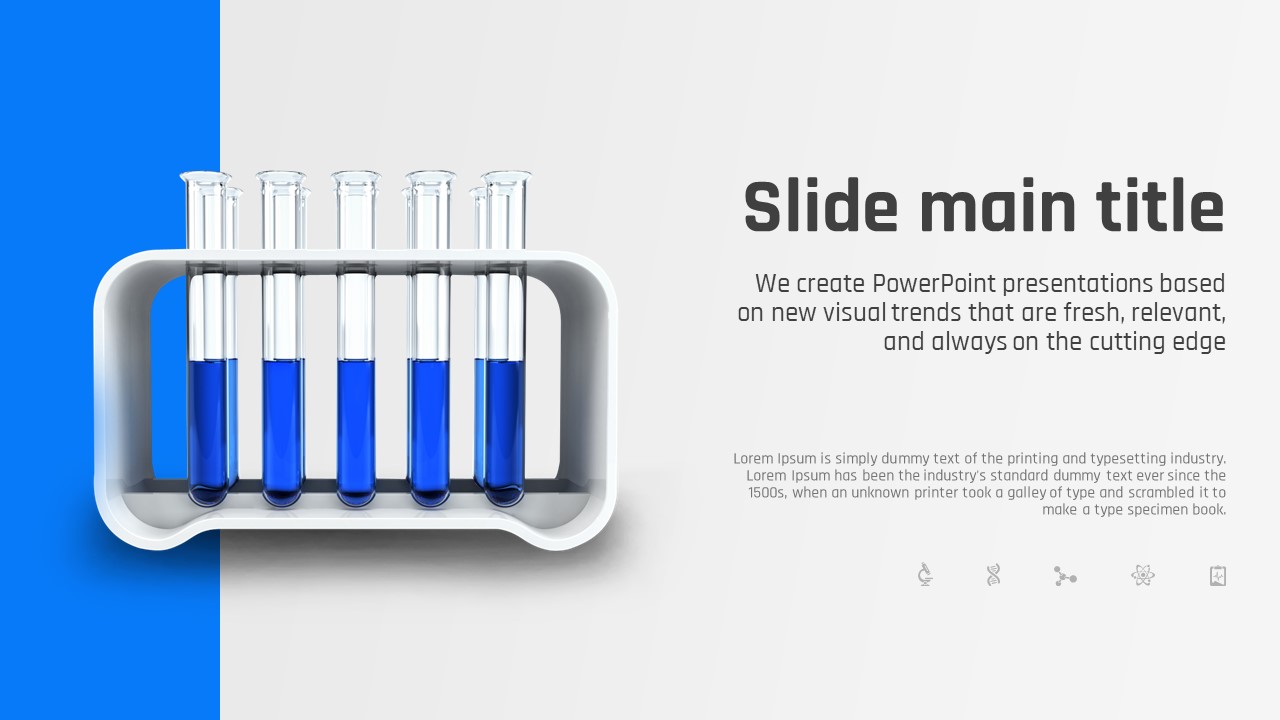
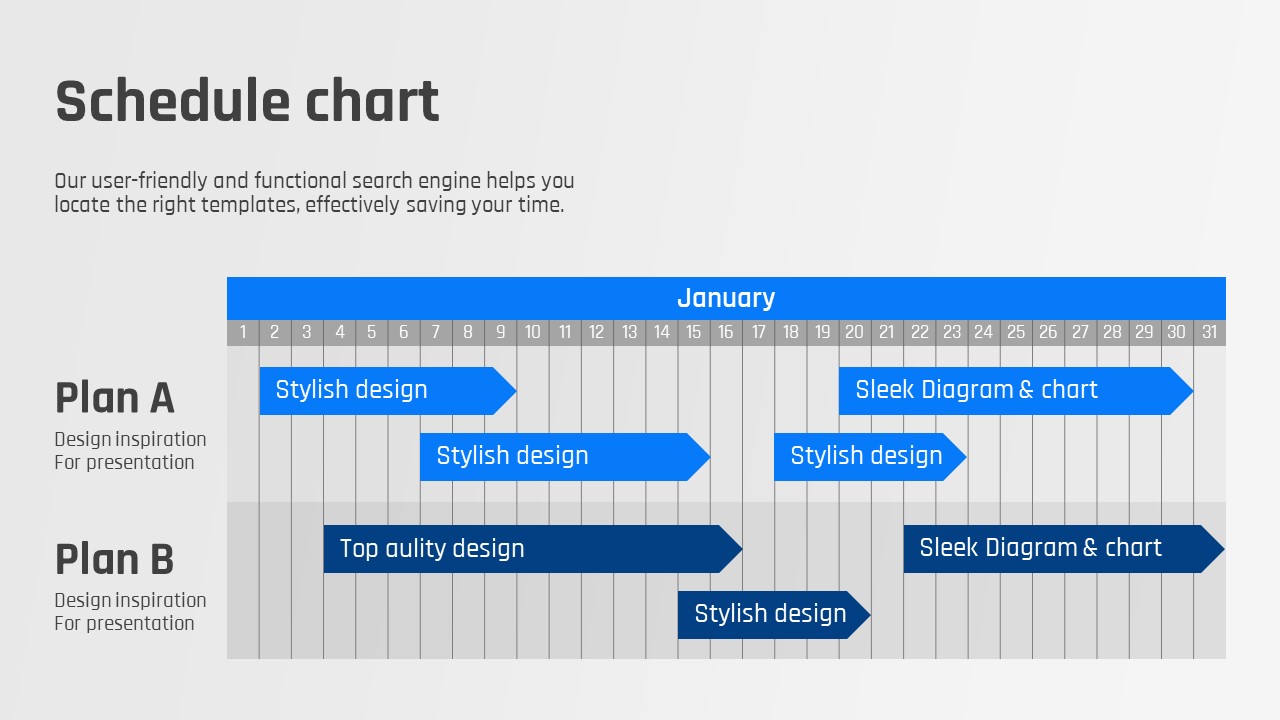
A professional PowerPoint template designed for science and medical research presentations, featuring a clean white and light gray background with vivid blue accent colors. The layout pairs DNA structure imagery with line-style icons to create a credible, data-driven visual identity. This 30-slide PPTX set includes a title slide, a 6-section table of contents with medical photography, a 4-step process diagram, a doughnut chart, a hub-style value comparison layout, an infographic slide, a data comparison table, and section cover slides with a bold blue footer bar. The balanced two-column structure—text and diagrams on the left, scientific imagery on the right—makes complex research data easy to follow. All slides are fully editable in PowerPoint, allowing you to replace placeholder text, figures, and images with your own research content in minutes. Ideal for academic conferences, clinical study reports, and pharmaceutical or biotech investor presentations.
Usage Points
-
Main Usage
Designed to present scientific research findings, clinical data, and medical analysis results in a professional and visually structured format. Ideal for academic conferences, hospital reports, and pharmaceutical or biotech company presentations targeting investors and partners.
-
How to Use
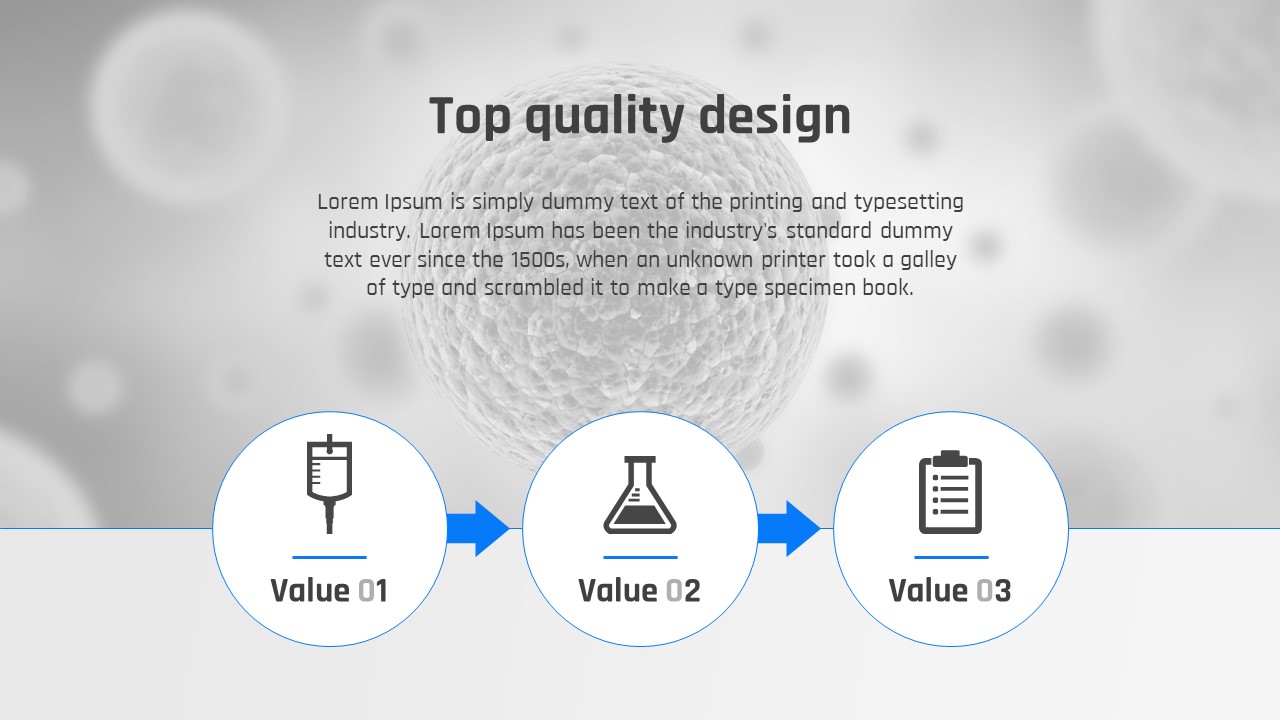
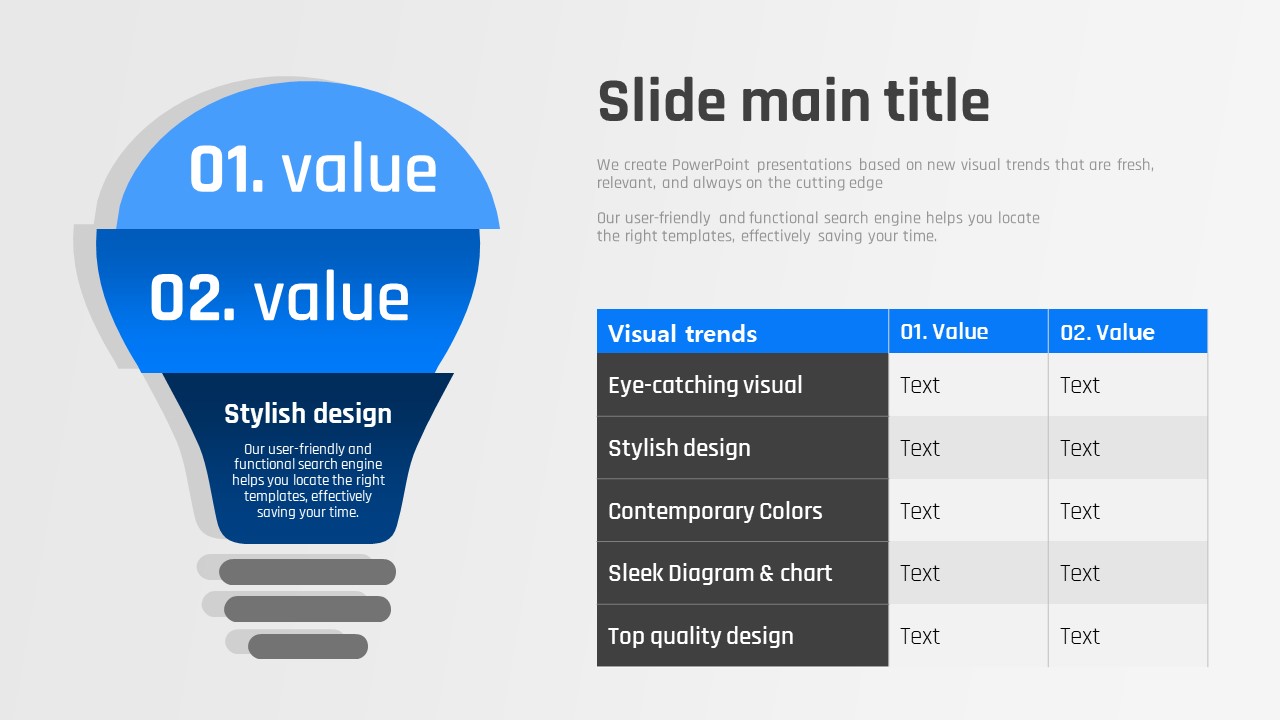
Open the PPTX file and replace placeholder text, numbers, and images with your actual research data. Use the 4-step process diagram to explain your methodology, the doughnut chart for quantitative results, and the comparison table to highlight key data differences across groups or time periods.
-
Recommended For
Graduate students and researchers preparing academic presentations, medical professionals reporting clinical study outcomes, pharmaceutical and biotech companies presenting to investors, and speakers at science conferences or seminars who need a credible, data-focused slide deck.
-
Slide Structure
Includes a title slide with DNA imagery, a 6-section contents slide with medical photography, a 4-step process diagram, a doughnut chart data slide, a 6-item hub-style value comparison, an infographic with comparison table, and section cover slides with a vivid blue footer bar — 30 slides total.
Related Products
-

Robot PPT Wide Template – Innovative Design and Efficiency
#Science/Medical
-

Plastic Surgery Presentation Template – Professional Visual Representation
#Science/Medical
-

Rocket Presentation Wide Template – Sleek and Intuitive Design
#Science/Medical
-

Oriental Medicine Presentation Wide – Modern and Stylish Design
#Science/Medical
