Visualizing Research Results and Objectives – Strong Strategy and Vision
RJ0700026_27
- Last Update 07/29/2025
- File Size 0.4MB
- # of Slides 2
- File Format PPTX
- Slide Ratio 16:9
- Color
Keywords
- #Content-Based Slides
- #Design-Based Slides
- #Company Introduction
- #Business Vision and Strategy
- #Diagram
- #Text Box
- #Other
- #Core Values, Vision, and Mission
- #Business Vision
- #Cluster
- #Closed Cluster Diagram
- #Arrow
- #16:9
- #arrow diagram PowerPoint
- #3-step process slide
- #value visualization presentation
- #circular diagram template
- #vision objective slide deck
About the Product
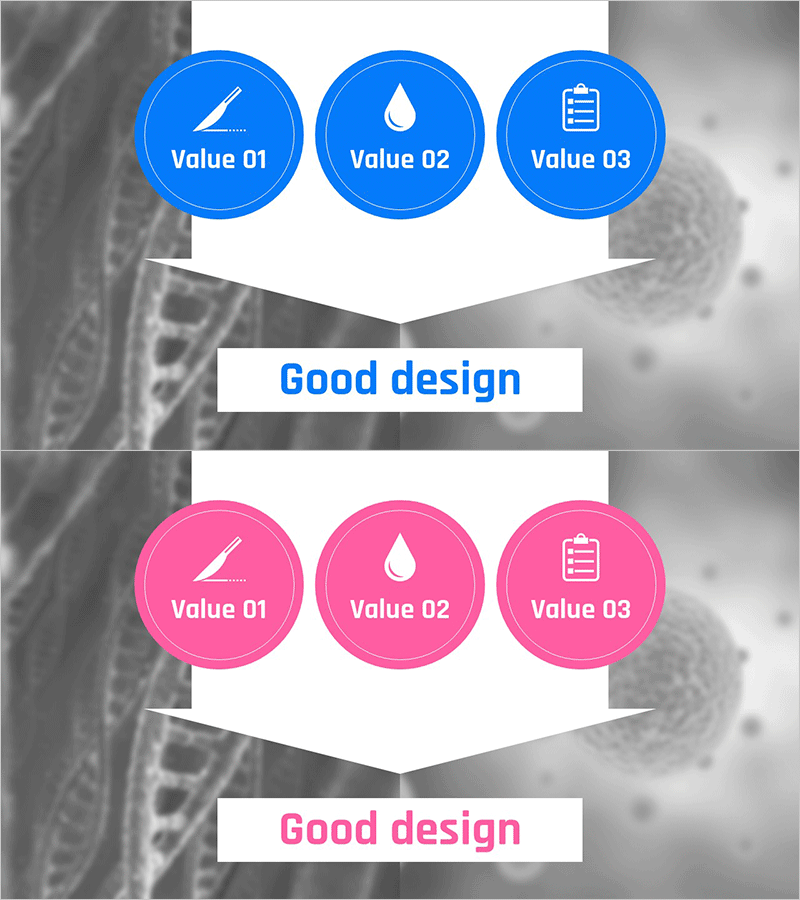
A PowerPoint slide set that visualizes research outcomes and core values through a 3-step circular arrow diagram. Composed of 2 slides in blue and pink dual-tone colors, each stage features icons and text areas to clearly communicate objectives, achievements, and vision. Optimized for 16:9 widescreen format, this slide deck is ready for immediate use in corporate presentations, research result reports, and strategic planning sessions. Each circular node is independently editable, making it easy to customize content for different industries and departments.
Usage Points
-
Main Usage
Visualizes research findings, business objectives, and core values in sequential stages to enhance audience comprehension. The arrow-connected flow clearly conveys cause-and-effect relationships and strategic direction across three key elements.
-
How to Use
Replace the icons and text in each circular node with your own content. Use the blue slide for corporate or technical topics, the pink slide for creative or innovation themes, or mix both colors for diverse presentation contexts.
-
Recommended For
Ideal for academic thesis presentations at research institutions and universities, corporate strategy meetings, new product development reports, and marketing campaign objective presentations. Recommended for executive, investor, and team-level presentations requiring credible visual communication.
-
Slide Structure
2-slide set: blue-tone slide with 3 circular nodes, icons, and text areas; pink-tone slide with identical structure. Nodes are connected by arrows to express sequential flow. Gray-toned background overlay enhances professional appearance.
Related Products
-

Vision and Goals PC Mockup Diagram – Clear Visualization for Strategic Advancement
#Company Introduction #Business Vision and Strategy #Diagram
-

Business Service Composition Diagram – Intuitive Visualization and Strategic Guidance
#Business Vision and Strategy #Technical Approach #Diagram
-

Goal & Vision STEP4 Diagram – Designing the Future of Your Business
#Company Introduction #Business Vision and Strategy #Diagram
-

Construction Company Goals & Vision Diagram – Capturing Innovative Vision
#Company Introduction #Business Vision and Strategy #Diagram
