Experimental Area Diffusion Diagram – Customizing Business Introduction
RJ0700026_25
- Last Update 07/29/2025
- File Size 0.1MB
- # of Slides 2
- File Format PPTX
- Slide Ratio 16:9
- Color
Keywords
- #Content-Based Slides
- #Design-Based Slides
- #Company Introduction
- #Business Introduction
- #Diagram
- #Business Areas
- #Business Areas
- #Spread
- #Centralized Diagram
- #16:9
- #radial diagram PowerPoint
- #diffusion diagram slide template
- #5-section diagram presentation
- #business area analysis PowerPoint
- #how to create radial diagram in PowerPoint
About the Product
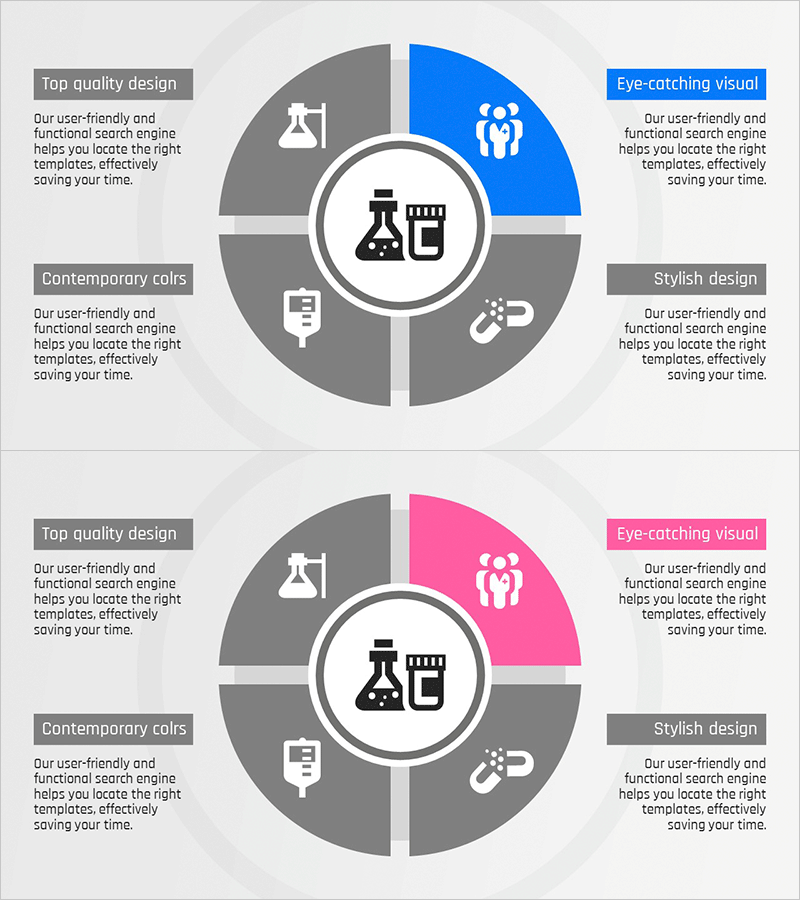
A radial diffusion diagram PowerPoint slide that expands from a central concept into five distinct areas. This design is ideal for presenting company overviews, business strategies, product features, organizational structures, and marketing initiatives. The blue accent color contrasts with gray tones to highlight key areas, while icons and text descriptions in each section enhance information clarity. The slide deck consists of two slides in 16:9 widescreen format, with fully editable colors and text fields for customization.
Usage Points
-
Main Usage
Effectively presents a central concept with five related areas or elements simultaneously, making it ideal for comparing and explaining multiple dimensions. Use this diagram in company introduction slides to categorize business domains, or in strategy sessions to visualize key initiatives. The design emphasizes equal relationships between the central theme and surrounding sections.
-
How to Use
Replace the central icon and text with your main topic, then customize the five section titles and descriptions to match your presentation content. Adjust section colors to align with your company brand palette, or swap icons with relevant imagery for visual consistency. Add bullet points if text content is extensive to improve readability and audience engagement.
-
Recommended For
Executive reports, business plans, product launch presentations, organizational structure explanations, and marketing strategy meetings. Particularly useful for consulting firms, IT companies, financial institutions, and manufacturers presenting complex business domains. Well-suited for C-level presentations and client proposal materials requiring multi-faceted explanations.
-
Slide Structure
Features a circular center with an icon, surrounded by five radially arranged sections: top-right (blue accent), right (gray), bottom (gray), left (gray), and top-left (gray). Each section contains independent text boxes and icon areas with visual connections flowing from the center outward. Two color variations are provided: blue-accent and pink-accent versions for design flexibility.
Related Products
-

Mobile Security Service Diagram
#Company Introduction #Business Introduction #Diagram
-

Travel Business Services Area – Effective Diagram Design
#Company Introduction #Business Introduction #Diagram
-

Business Area Circular Diagram – Enhancing Corporate Presence
#Company Introduction #Business Introduction #Diagram
-

Astronomy Earth Diagram PowerPoint – Visual Exploration
#Company Introduction #Business Introduction #Diagram
