Status of Research and Development by Topic – Innovation and Trust
RJ0700026_14
- Last Update 07/29/2025
- File Size 0.4MB
- # of Slides 2
- File Format PPTX
- Slide Ratio 16:9
- Color
Keywords
- #Content-Based Slides
- #Design-Based Slides
- #Product/Service Introduction
- #Market and Competitor Analysis
- #Diagram
- #Graph
- #Development Status
- #Market Share
- #Cluster
- #Circles
- #Chain Diagram
- #Doughnut Chart
- #16:9
- #donut chart PowerPoint
- #pie chart slide template
- #ratio comparison presentation
- #multi-segment donut graph
- #market share PPT slide
- #data visualization PowerPoint
About the Product
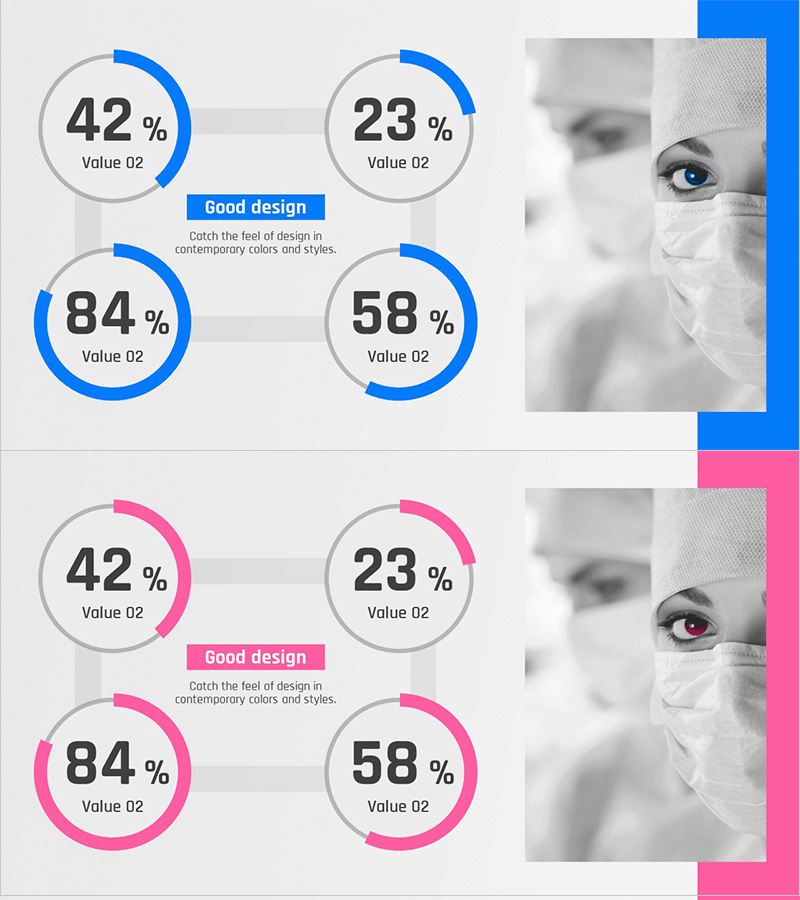
A PowerPoint slide set featuring donut-shaped pie charts for visualizing R&D status, market share, departmental performance, and comparative metrics. Available in two color themes—blue and pink—with four donut graphs per slide arranged in a 2×2 grid layout. Optimized for 16:9 widescreen format with 2 slides total. Each donut chart displays percentage values and label areas, enabling immediate data editing and multi-item ratio comparison. Ideal for data-driven presentations requiring intuitive numerical communication.
Usage Points
-
Main Usage
Designed to simultaneously display composition ratios across multiple categories such as R&D progress, market share distribution, departmental performance metrics, and product category breakdown. Each donut graph is independently editable, accommodating diverse data combinations and analytical scenarios.
-
How to Use
Double-click percentage values and labels on each donut chart to edit directly. Modify colors via shape formatting menu. Add legends or titles to clarify data context. Select blue or pink theme to match presentation tone. All elements are fully customizable within PowerPoint.
-
Recommended For
Executive reports, business performance presentations, marketing analysis materials, R&D status updates, quarterly results briefings, investor pitch decks, and strategic planning sessions. Recommended for data-intensive business presentations requiring clear ratio visualization.
-
Slide Structure
2-slide set with 4 donut-shaped pie charts per slide arranged in 2×2 grid. Each donut displays central percentage values with outer label areas. Color-coded in blue or pink gradient series. White text on gray background for high contrast and readability.
Related Products
-

Development Status Analysis Connection Diagram – Effective Information Delivery
#Product/Service Introduction #Market and Competitor Analysis #Diagram
-

Magic Donut Chart for Market Share Visualization – Key Information Delivery
#Product/Service Introduction #Market and Competitor Analysis #Diagram
-

Aviation Service Development Schedule Donut Circle Graph
#Product/Service Introduction #Market and Competitor Analysis #Diagram
-

System Development Status Graph – Visualizing Market Share
#Product/Service Introduction #Market and Competitor Analysis #Diagram
