Visualizing Experimental Results with Bar Chart Slide
RJ0700026_12
- Last Update 07/29/2025
- File Size 0.6MB
- # of Slides 2
- File Format PPTX
- Slide Ratio 16:9
- Color
Keywords
- #Content-Based Slides
- #Design-Based Slides
- #Product/Service Introduction
- #Market and Competitor Analysis
- #Graph
- #Other
- #Development Status
- #Competitive Advantage
- #16:9
- #bar chart PowerPoint slide
- #horizontal bar chart presentation
- #data visualization slide
- #comparison chart PPT
- #how to make a bar chart in PowerPoint
About the Product
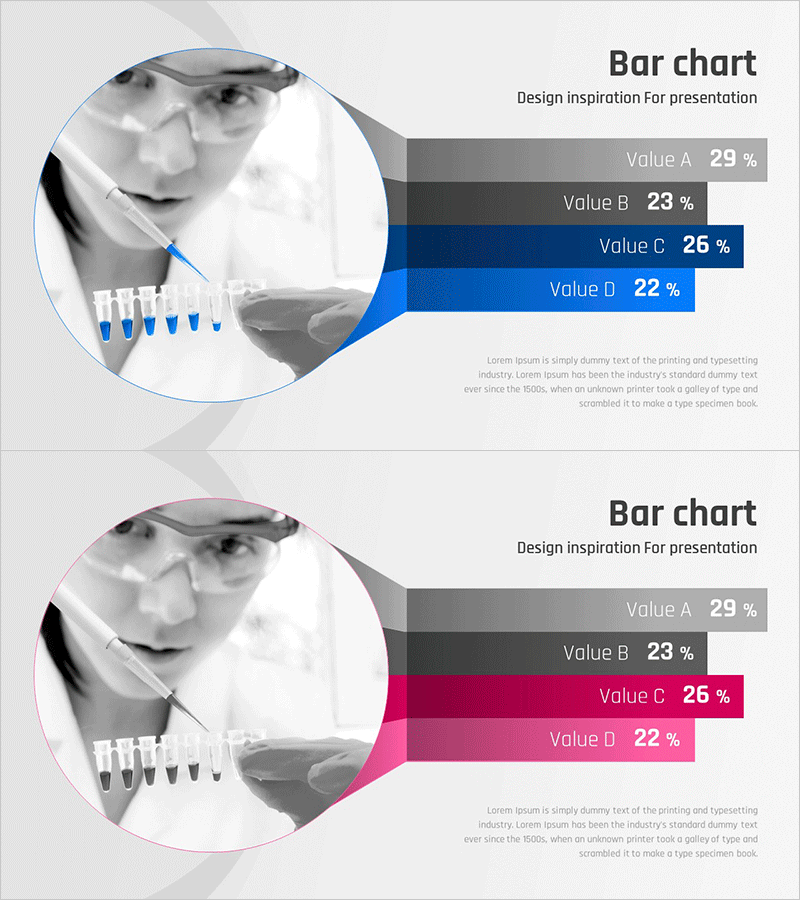
A PowerPoint slide that visualizes experimental results and market data using a 4-step horizontal bar chart. The layout separates a circular image area on the left from the data chart on the right, enhancing visual credibility. Two color versions—blue and pink—are provided so you can choose based on your presentation topic and corporate branding. Each item displays percentage values clearly, making it immediately applicable for financial reports, market analysis, and development status presentations. Provided in 16:9 widescreen format with 2 slides in PPTX format.
Usage Points
-
Main Usage
Compare and analyze quantitative data using a 4-step horizontal bar chart to strengthen presentation persuasiveness. Suitable for visualizing experimental results, market share, financial metrics, and competitive analysis. The left image area provides context while the right chart clearly communicates numerical data.
-
How to Use
Insert experimental photos, product images, or market photos in the left circular image area and input data into the right bar chart. Edit item names and percentage values to match your presentation content. Choose between blue or pink versions based on your corporate branding and presentation tone.
-
Recommended For
Recommended for market analysis, financial reports, development status presentations, competitive analysis, experimental result reports, and investor briefings. Ideal for analysts, finance professionals, researchers, marketers, and executives who need to support data-driven decision-making.
-
Slide Structure
2-slide set with each slide featuring one circular image input area on the left and a 4-step horizontal bar chart (Value A–D) on the right. Includes title area, subtitle area, and descriptive text area to convey context alongside data.
Related Products
-

Camera Donut Chart and Table – Market and Competitive Analysis
#Product/Service Introduction #Market and Competitor Analysis #Graph
-

Competitive Advantage Analysis Silhouette Graph – Market and Competitor Insights
#Product/Service Introduction #Market and Competitor Analysis #Graph
-

Competitive Strengths Comparison Chart – An Effective Market Analysis Tool
#Product/Service Introduction #Market and Competitor Analysis #Diagram
-

Musicians and Gauge Charts Slide – The Uniqueness of Data Visualization
#Product/Service Introduction #Business Introduction #Graph
