Introduction of Observation Results – Strategies through Data Clustering
RJ0700026_15
- Last Update 07/29/2025
- File Size 4.9MB
- # of Slides 2
- File Format PPTX
- Slide Ratio 16:9
- Color
Keywords
- #Content-Based Slides
- #Design-Based Slides
- #Product/Service Introduction
- #Business Vision and Strategy
- #Diagram
- #Program Introduction
- #Business Goals
- #Cluster
- #Closed Cluster Diagram
- #16:9
- #cluster diagram PowerPoint
- #data visualization slide template
- #hierarchical structure diagram
- #scientific presentation PPT
- #how to create cluster diagram in PowerPoint
About the Product
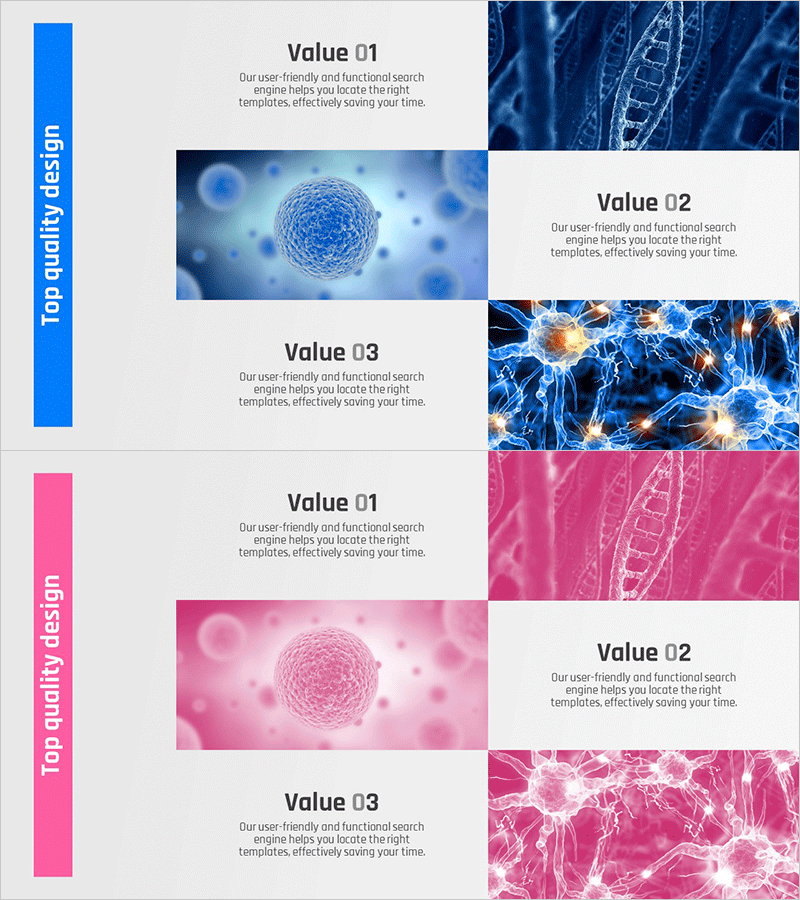
A professional cluster diagram PowerPoint slide designed to present observation results and data analysis effectively. This 2-slide presentation template features dual color schemes—blue and pink—optimized for visualizing cellular, molecular, and network structures. The asymmetrical layout combines a vertical text bar on the left with image areas on the right, creating clear information hierarchy. Each slide emphasizes three data points (Value 01, 02, 03) with supporting visuals. Ideal for scientific presentations, technology briefings, and strategic analysis decks that require sophisticated data representation.
Usage Points
-
Main Usage
Presents scientific research findings, technology architecture, organizational structures, and data analysis results in hierarchical format. The radial structure with a central element (sphere, molecule, node) surrounded by supporting information enables intuitive communication of complex data relationships.
-
How to Use
Enter section titles (e.g., Observation Results, Technology Overview, Strategic Analysis) in the left vertical text box. Place corresponding data visualizations in the right image area. Use the blue color scheme for technology, science, and IT presentations; pink for marketing, innovation, and creative topics.
-
Recommended For
Scientists, researchers, technology leaders, data analysts, strategy consultants, and product development teams presenting research findings, technology stacks, market analysis, and organizational innovation. Suitable for academic seminars, technology conferences, and executive briefings.
-
Slide Structure
2-slide template with consistent layout. Each slide divides into a left vertical color bar (blue or pink) and right content area. The right section displays three data points (Value 01, 02, 03) with accompanying text and supporting images (cells, molecules, neural networks, etc.) arranged vertically.
Related Products
-

Business Goal Diagram – A Fresh Vision for Financial Planning
#Product/Service Introduction #Business Vision and Strategy #Diagram
-

Ringer Shape Subdivided Column Graph for Global Trade Business Objectives
#Product/Service Introduction #Business Vision and Strategy #Diagram
-

Business Objectives Square Diagram – Effective Strategy Formulation
#Product/Service Introduction #Business Vision and Strategy #Diagram
-

Introducing the Business Investment Program – Cluster and Closed Diagram
#Product/Service Introduction #Business Vision and Strategy #Diagram
